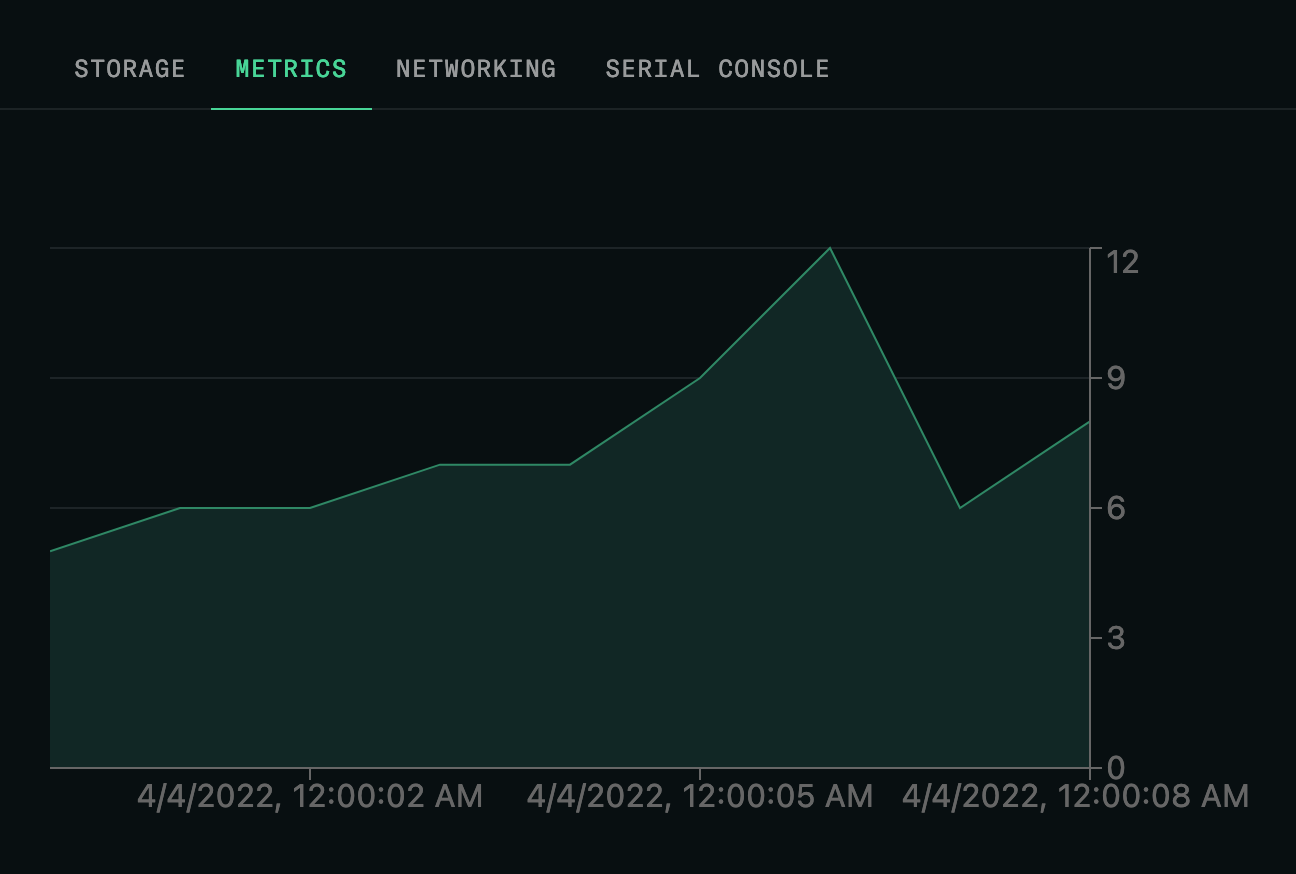
Display a metric #1095
Display a metric #1095
Conversation
|
The latest updates on your projects. Learn more about Vercel for Git ↗︎
|
|
|

aa80fae to
a3fbd8c
Compare
016f21f to
124ca60
Compare
d7e708b to
48ab308
Compare
|
|
|
|
|
Can I run this change on folgers and see how it works with "real" data? |
|
Yeah, definitely, though it will be easier to do after I merge this and update the pinned console in Omicron. Two undone todos you will definitely run into:
|
vite.config.ts
Outdated
| // plugins: | ||
| // mode === 'development' ? ['./libs/babel-transform-react-display-name'] : [], | ||
| // }, | ||
| // }), |
There was a problem hiding this comment.
Ran into an issue where it was trying to put a displayName on my hook and I have no idea why. Will look into it.
There was a problem hiding this comment.
It's trying to put a displayName
dateTimeRangePicker.displayName = "dateTimeRangePicker - app/components/form/fields/useDateTimeRangePicker.tsx";on this line, which is an element, not a component
const dateTimeRangePicker = <Formik ... />Got a minimal repro. Holy shit AST Explorer rules.
There was a problem hiding this comment.
This should only be happening for top level components meaning one of the escape hatches is failing. I'm fiddling with it.
There was a problem hiding this comment.
I resolved this in #1133. There needs to be another follow up to fix an invalid base assumption, but the proposed fix should be sufficient.
9a787d0 to
c8217be
Compare
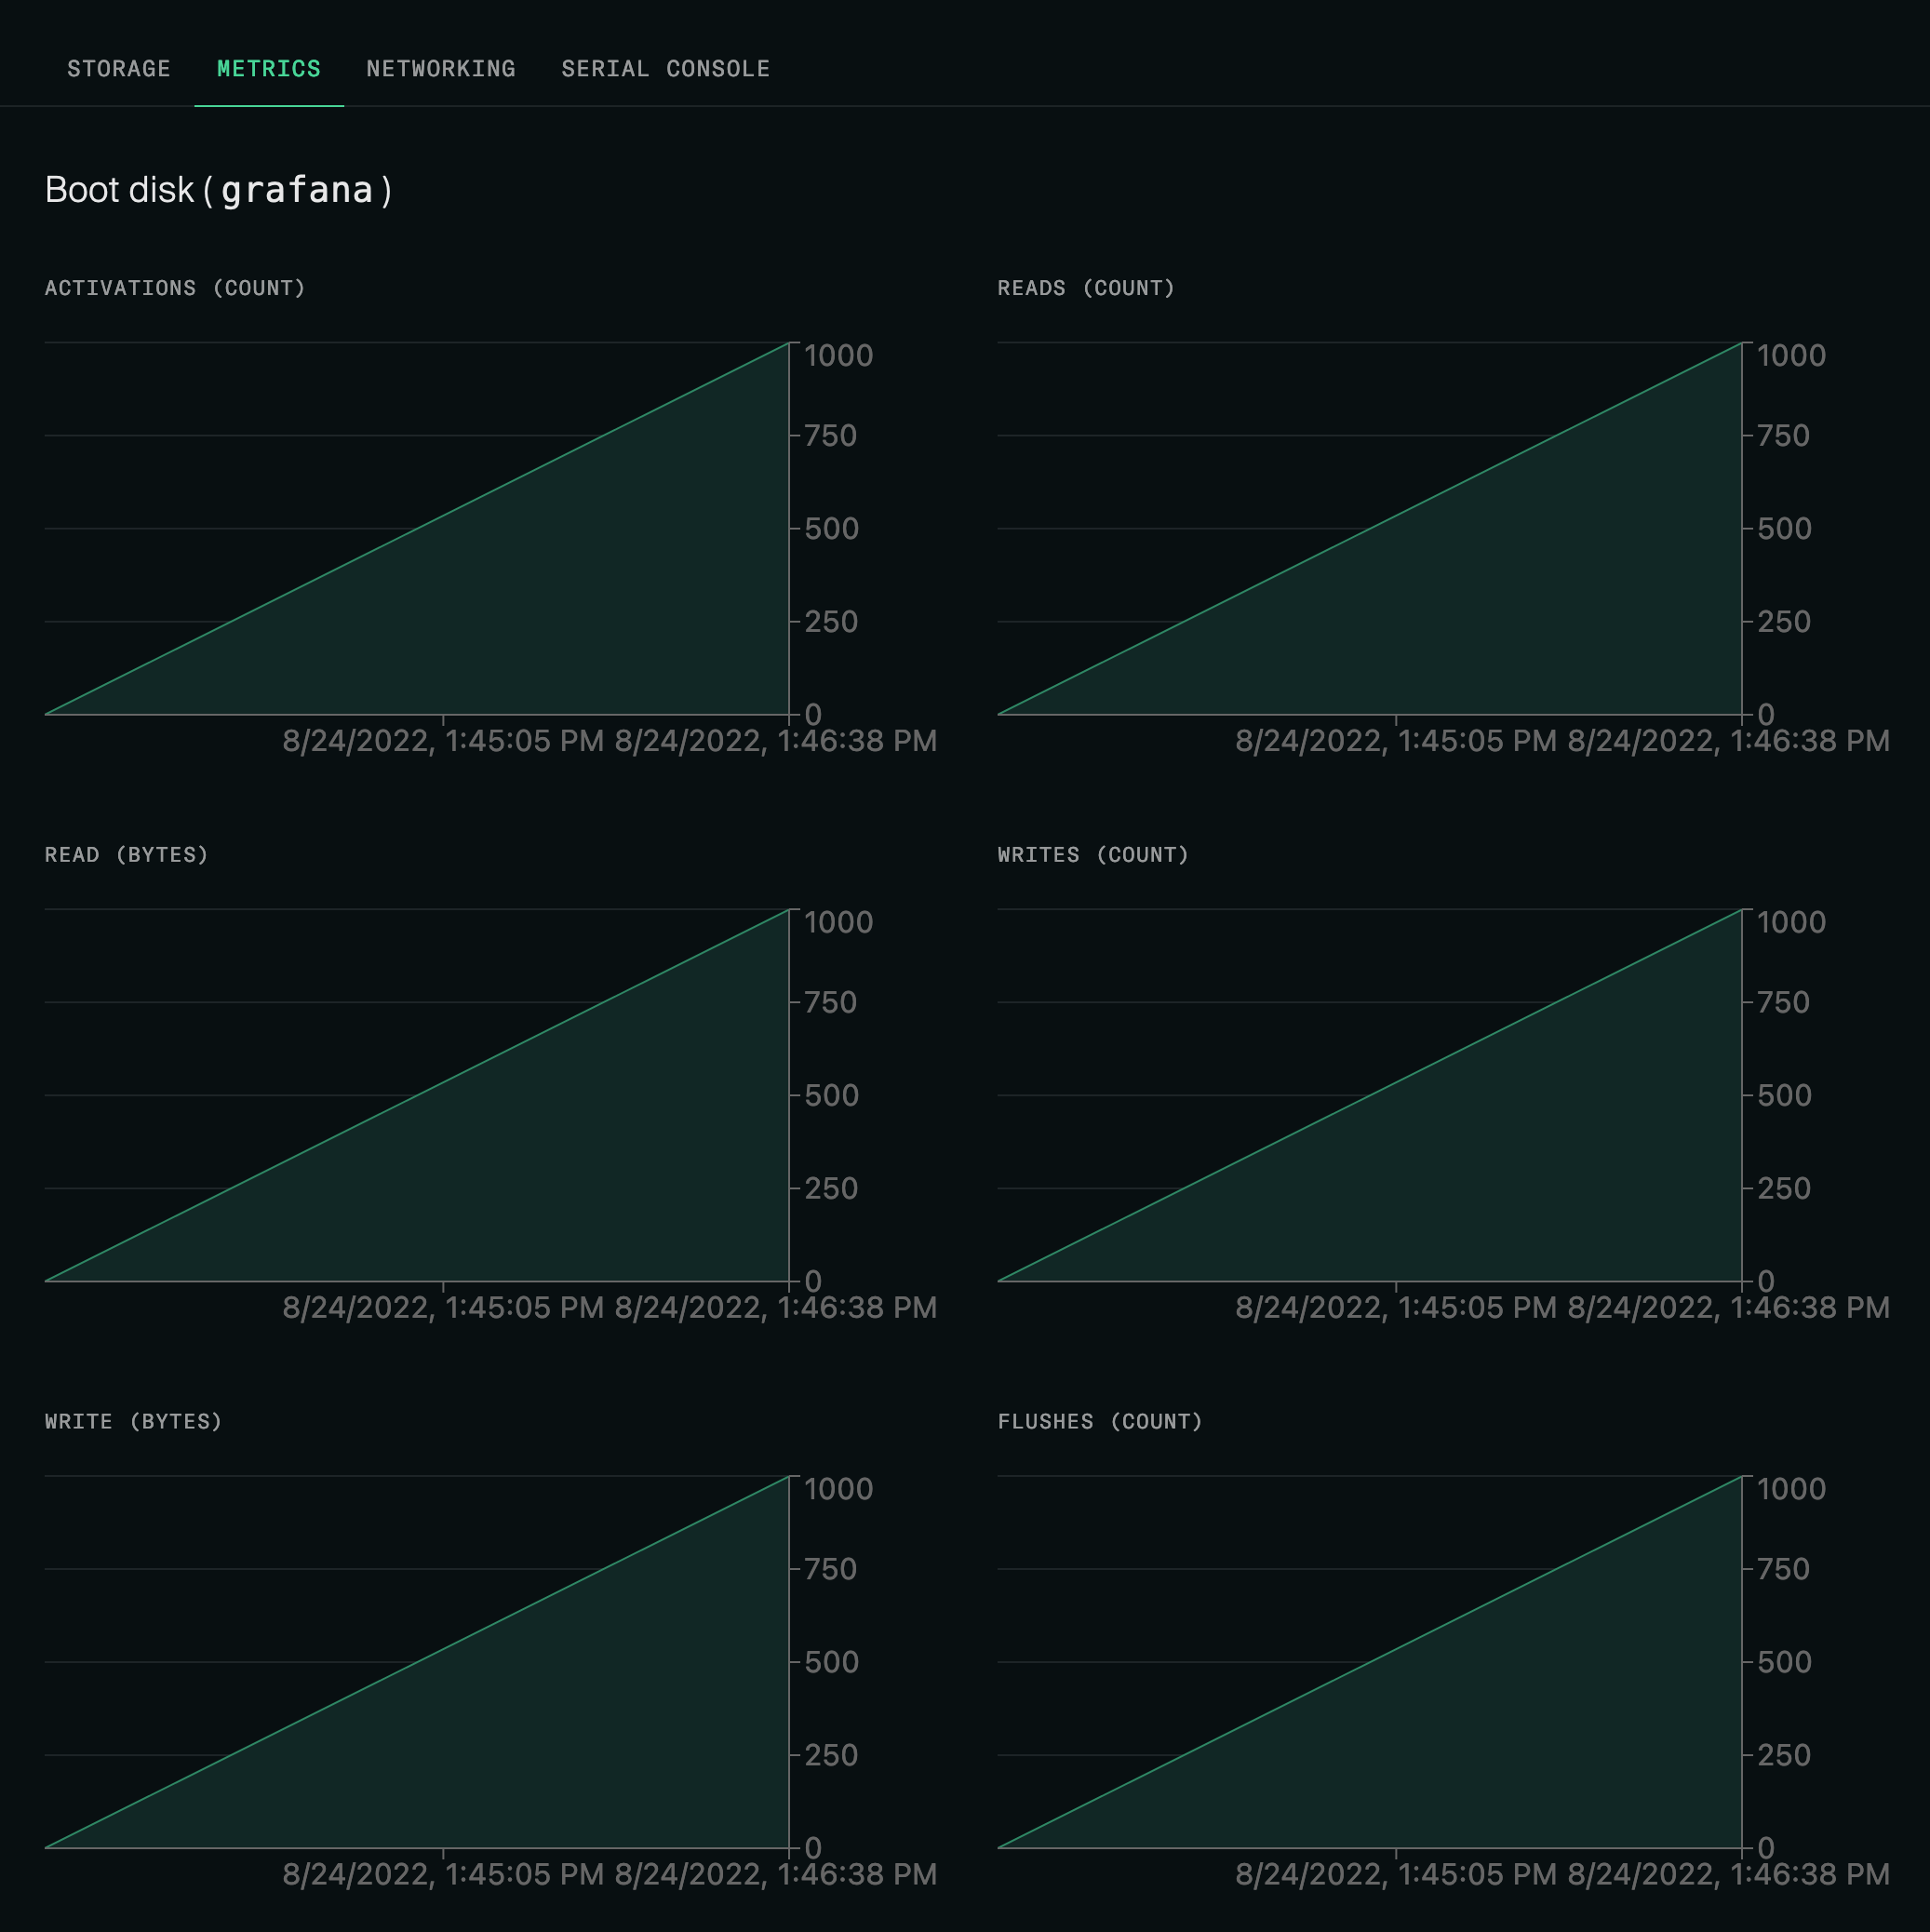
| {/* TODO: need a nicer way of saying what the boot disk is */} | ||
| Boot disk ( <code>{diskName}</code> ) |
| const longDateTime = (ts: number) => format(new Date(ts), 'MMM d, yyyy HH:mm:ss zz') | ||
|
|
||
| // TODO: change these to theme colors so they work in light mode | ||
| const LIGHT_GRAY = 'var(--base-grey-600)' |
There was a problem hiding this comment.
The closest I can find that makes sense here is chart-fill-inactive which maps to base-black-600. Not sure if that's right or not though.
Co-authored-by: Justin Bennett <[email protected]>
 leftwo
left a comment
leftwo
left a comment
There was a problem hiding this comment.
the activated stat is really an internal stat for the upstairs, and I don't think we need to expose that to the end user.
| // TODO: we're only pulling the first page. Should we bump the cap to 10k? | ||
| // Fetch multiple pages if 10k is not enough? That's a bit much. |
There was a problem hiding this comment.
It'll be interesting to see the granularity of data required to get meaningful visualizations at different time ranges. I really hope 10k isn't necessary, that seems like an awfully large payload.
There was a problem hiding this comment.
Yeah, I think if we were doing moving averages server-side to reduce the size of the result set, I would never choose to get that many points back.
 zephraph
left a comment
zephraph
left a comment
There was a problem hiding this comment.
Great start. I know there are still a lot of TODOs and follow up work, but I'm all for rolling forward.
It's time. Closes #1051
Limitations/issues