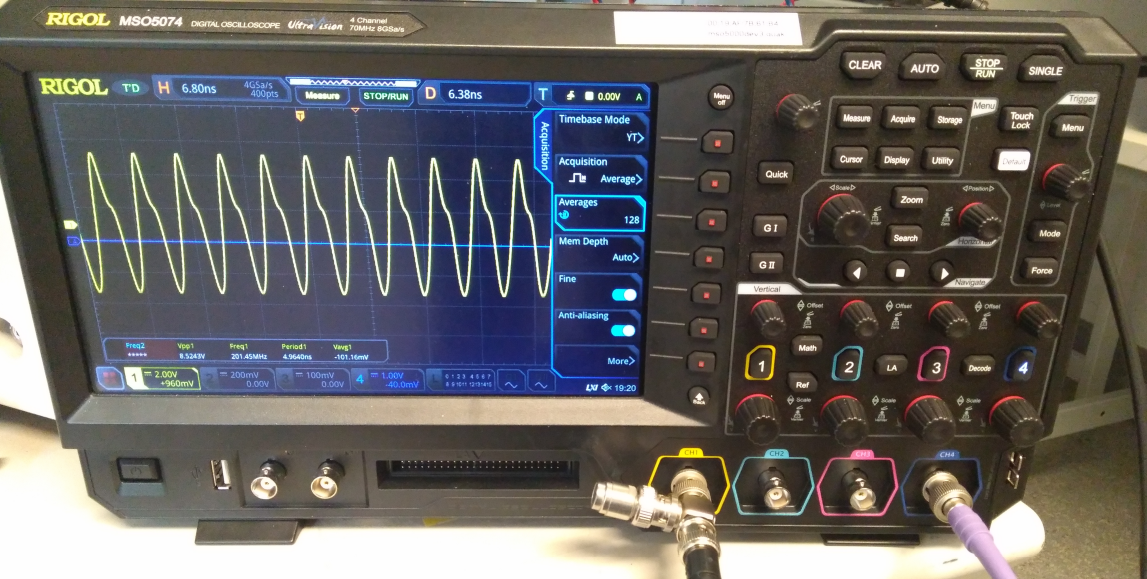
A simple Python library and utility to control and query data from Rigol MSO5xxx oscilloscopes (not supporting all features of the oscilloscope, work in progress). This library implements the Oscilloscope class from the pylabdevs package which exposes the public interface.
Patches for raw mode sample query by MasterJubei
There is a PyPi package that can be installed using
pip install pymso5000-tspspi
from pymso5000.mso5000 import MSO5000

with MSO5000(address = "10.0.0.123") as mso:
   print(f"Identify: {mso.identify()}")

   mso.set_channel_enable(0, True)
   mso.set_channel_enable(1, True)

   data = mso.query_waveform((0, 1))
   print(data)

   import matplotlib.pyplot as plt
   plt.plot(data['x'], data['y0'], label = "Ch1")
   plt.plot(data['x'], data['y1'], label = "Ch2")
   plt.show()
Note that numpy usage is optional for this implementation.
One can enable numpy support using useNumpy = True in the
constructor.
This module allows - via the pylabdevs base class to query
additional statistics:
meanCalculates the mean values and standard deviations- A single value for each channels mean at
["means"]["yN_avg"]and a single value for each standard deviation at["means"]["yN_std"]whereNis the channel number
- A single value for each channels mean at
fftruns Fourier transform on all queried traces- The result is stored in
["fft"]["yN"](complex values) and in["fft"]["yN_real"]for the real valued Fourier transform. AgainNis the channel number
- The result is stored in
ifftruns inverse Fourier transform on all queried traces- Works as
fftbut runs the inverse Fourier transform and stores its result inifftinstead offft
- Works as
correlatecalculates the correlation between all queried waveform pairs.- The result of the correlations are stored in
["correlation"]["yNyM"]for the correlation between channelsMandN
- The result of the correlations are stored in
autocorrelateperforms calculation of the autocorrelation of each queried channel.- The result of the autocorrelation is stored in
["autocorrelation"]["yN"]for channelN
- The result of the autocorrelation is stored in
To request calculation of statistics pass the string for the
desired statistic or a list of statistics to the stats
parameter of query_waveform:
with MSO5000(address = "10.0.0.123") as mso:
	data = mso.query_waveform((1,2), stats = [ 'mean', 'fft' ])
More documentation in progress ...
identify()- Connection management (when not using
withcontext management):connect()disconnect()
set_channel_enable(channel, enabled)is_channel_enabled(channel)set_sweep_mode(mode)get_sweep_mode()set_trigger_mode(mode)get_trigger_mode()force_trigger()set_timebase_mode(mode)get_timebase_mode()set_run_mode(mode)get_run_mode()set_timebase_scale(secondsPerDivision)get_timebase_scale()set_channel_coupling(channel, couplingMode)get_channel_coupling(channel)set_channel_probe_ratio(channel, ratio)get_channel_probe_ratio(channel)set_channel_scale(channel, scale)get_channel_scale(channel)query_waveform(channel, stats = None)off()
This package comes with a mso5000fetch command line utility. This utility
allows one to simply fetch one or more traces and store them either inside an npz
or a matplotlib plot. In addition it can run all of the pylabdevs statistics
functions (currently no plot, only stored in the npz) and execute manually assisted
differential scans.
Help for this utility is available via mso5000fetch --help
