move width computation to setup_params()
#4416
Conversation
|
Is this computation done per facet? |
|
No, globally. I'm not married to either but it seems we usually do these kind of computations globally |
|
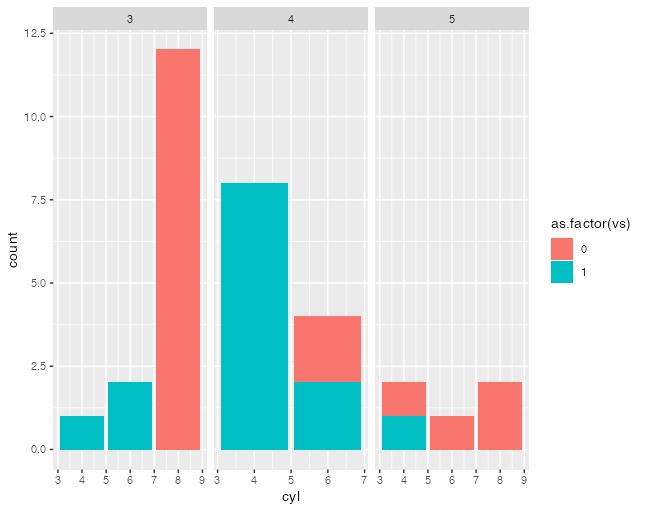
I think the case to check is a faceted plot where there are different numbers of bars and axes are set to free. I can't think of a dataset off the top of my head to make such a plot, but I have definitely encountered them. The current behavior is to adjust the bar width to fill up the available space. I'm not sure if that's good or bad, but we should at least check it. Such plots certainly do exist. If I have some time later today I'll try to make an example. |
library(ggplot2)
ggplot(mtcars,aes(cyl,fill=as.factor(vs)))+
   geom_bar()+
  facet_grid(~gear,scales="free" )
#> Warning: position_stack requires non-overlapping x intervals

#> Warning: position_stack requires non-overlapping x intervals
Created on 2021-04-13 by the reprex package (v2.0.0) |

|
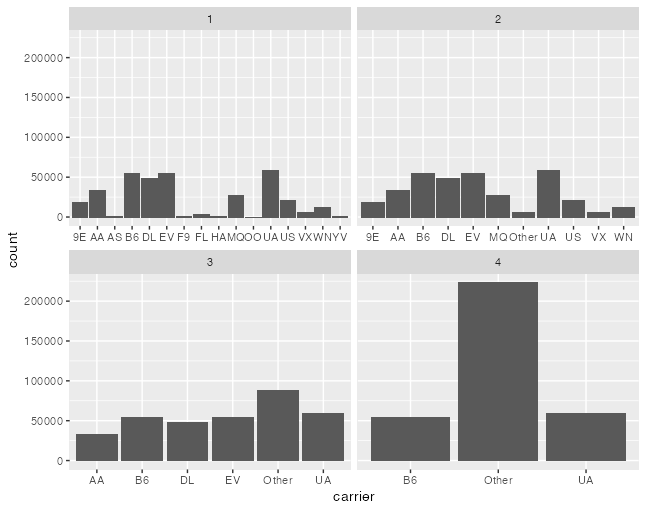
I meant something like this. Will it change? Also, notice how I have no strong opinion on whether bar widths should be the same or not in this type of a plot, I just wanted to point out that I've seen plots like this one, more than once. library(tidyverse)
library(nycflights13)
d1 <- flights %>%
select(carrier) %>%
mutate(group = 1)
d2 <- flights %>%
select(carrier) %>%
mutate(
carrier = as.character(fct_lump_n(carrier, n = 10)),
group = 2
)
d3 <- flights %>%
select(carrier) %>%
mutate(
carrier = as.character(fct_lump_n(carrier, n = 5)),
group = 3
)
d4 <- flights %>%
select(carrier) %>%
mutate(
carrier = as.character(fct_lump_n(carrier, n = 2)),
group = 4
)
d <- rbind(d1, d2, d3, d4)
d %>%
ggplot(aes(carrier)) +
geom_bar() +
facet_wrap(~group, scales = "free_x")d %>%
count(carrier, group) %>%
ggplot(aes(carrier, n)) +
geom_col() +
facet_wrap(~group, scales = "free_x")Created on 2021-04-13 by the reprex package (v1.0.0) |


|
@clauswilke the output doesn't change because the width is encoded in the scale domain, i.e. a width of 0.9 seems bigger in a panel with fewer categories |
|
For completeness, this is @smouksassi's example rendered with this patch |
Fix #2047
This PR makes sure that width is calculated globally to avoid surprise behaviour outlined in #2047. There is a chance that this will break someones code, but I think it is pretty low