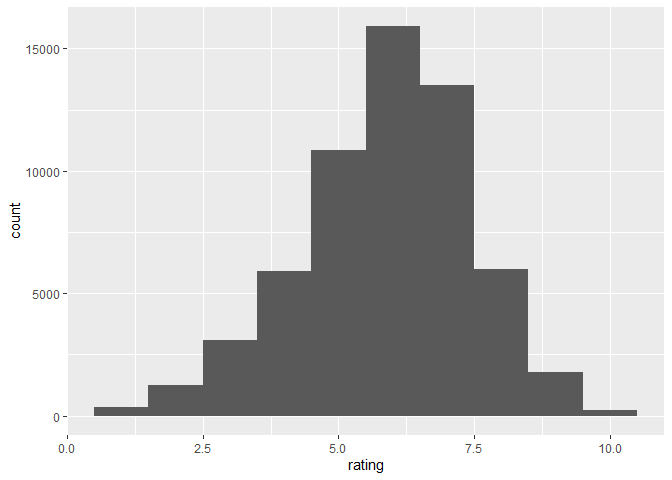
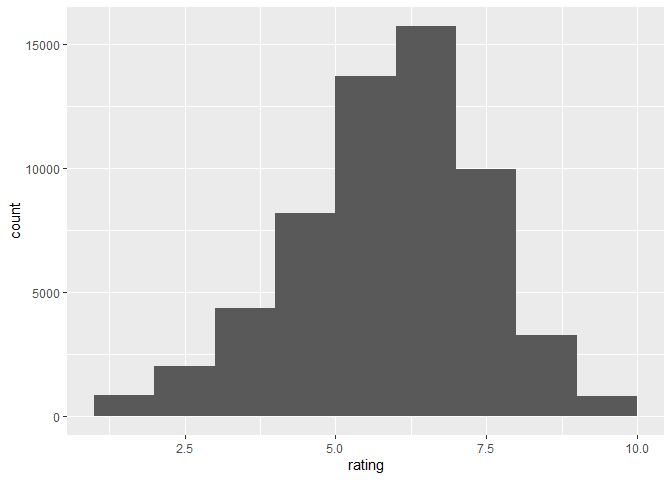
I am not sure if this is a bug or just rather unexpected (and undocumented) behaviour, but it feels like a bug to me. When adding boundary to bins in geom_histogram, the number of bins is reduced by one. See simple example below.
library("ggplot2")
library("ggplot2movies")

m <- ggplot(movies, aes(rating)) +
  geom_histogram(bins = 10)
m
nrow(layer_data(m))
#> [1] 10

m2 <- ggplot(movies, aes(rating)) +
  geom_histogram(bins = 10, boundary = 0)
m2

nrow(layer_data(m2))
#> [1] 9
Created on 2022-11-07 with reprex v2.0.2