scale_*_continuous trans and limits combination leading to blank plot #2715
Description
I noticed an odd behavior for scale_*_continuous limits parameter. I think it would be easiest to show an example rather than try to explain.
Set up the plot.
library("ggplot2")
df <- data.frame(trt = c("a", "b", "c"), outcome = c(2.3, 1.9, 3.2))
p <- ggplot(df, aes(trt, outcome)) + geom_col()
Start adjusting scale_y_continuous().
p + scale_y_continuous(trans = "log", limits = c(1, 5))
p + scale_y_continuous(trans = "log1p", limits = c(1, 5))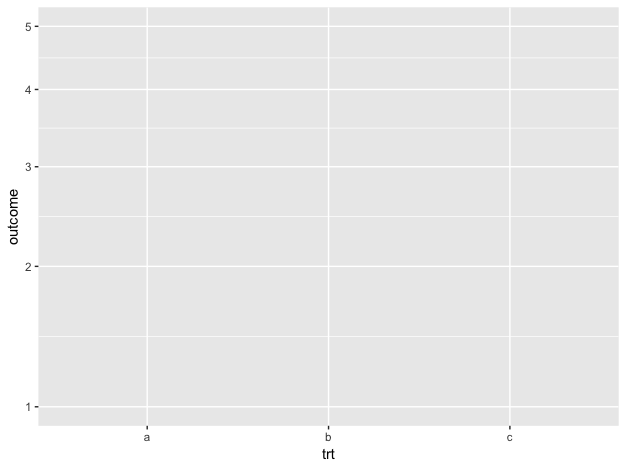
p + scale_y_continuous(trans = "log1p", limits = c(0, 5))
The first and third plots are expected, but why is the middle empty? There is no error or warning.
I am using R 3.4.4 with ggplot2 2.2.1.