This repository was archived by the owner on Apr 16, 2018. It is now read-only.

Description
Requested by Heather Van Dyke.
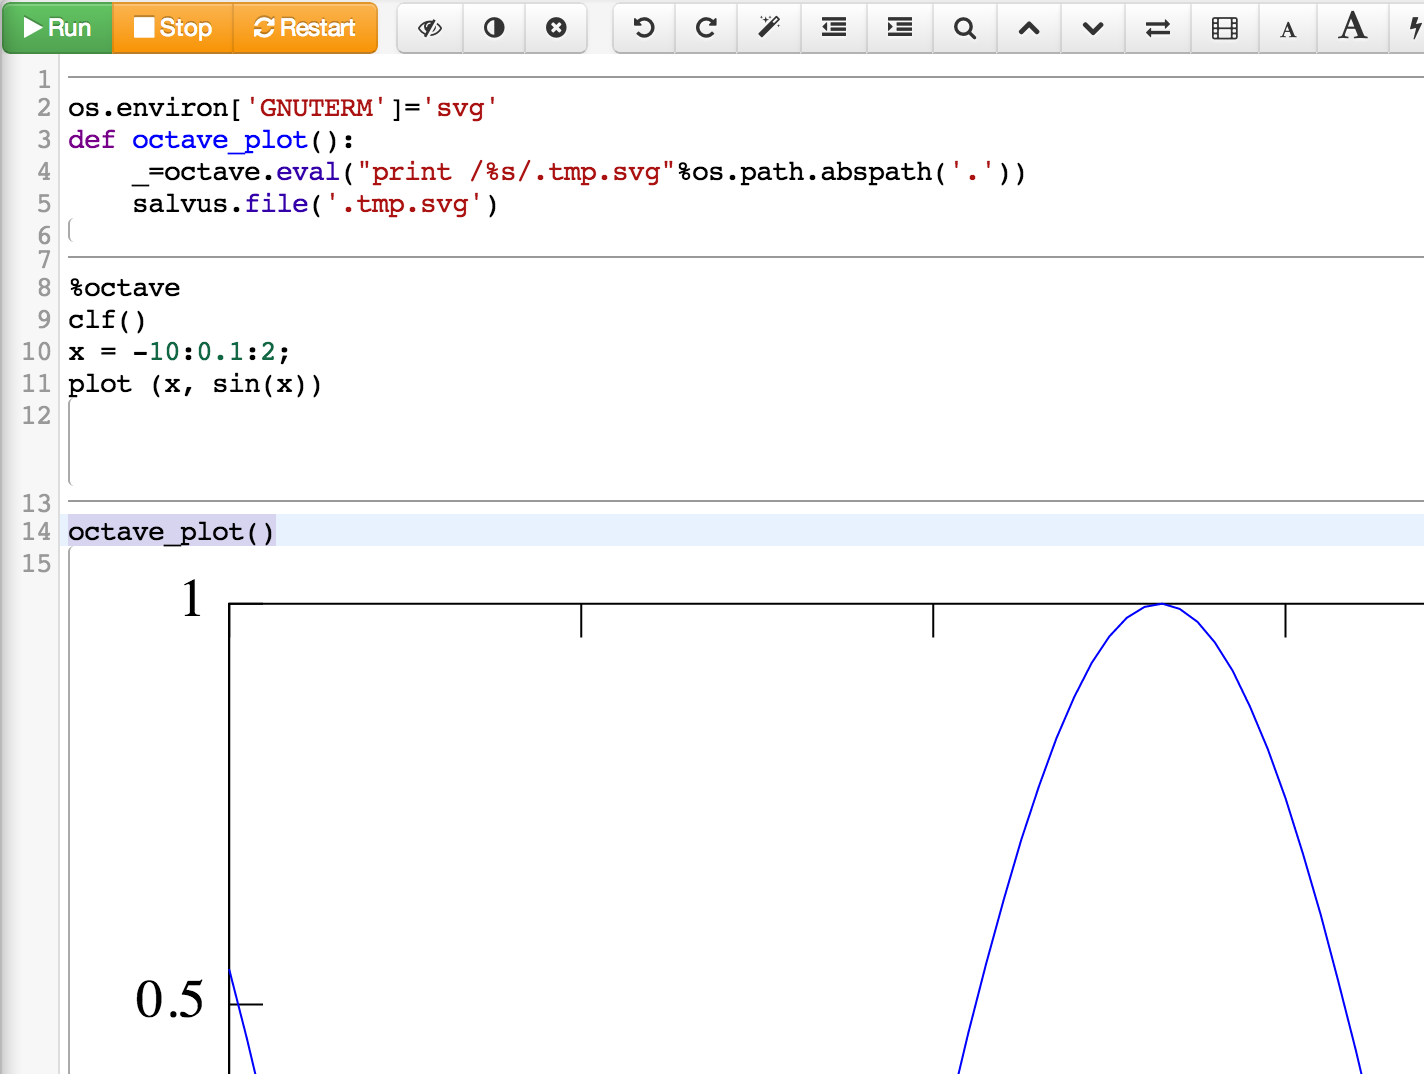
I'll do this in much the same way I made plotting just work for R worksheets. The key idea is illustrate by the following:
ONE. Run this code in a new Sage Worksheet before running octave.
os.environ['GNUTERM']='svg'
def octave_plot():
    _=octave.eval("print /%s/.tmp.svg"%os.path.abspath('.'))
    salvus.file('.tmp.svg')
TWO. Run this code in a cell to draw an Octave plot:
%octave
clf()
x = -10:0.1:2;
plot (x, sin(x))
THREE. Now type octave_plot() in a cell to render the current octave plot!
