Add IQ plotter class #948
Merged
Add IQ plotter class #948
Conversation
This file contains hidden or bidirectional Unicode text that may be interpreted or compiled differently than what appears below. To review, open the file in an editor that reveals hidden Unicode characters.
Learn more about bidirectional Unicode characters
Add discriminator_alpha option to set discriminator prediction transparency.
|
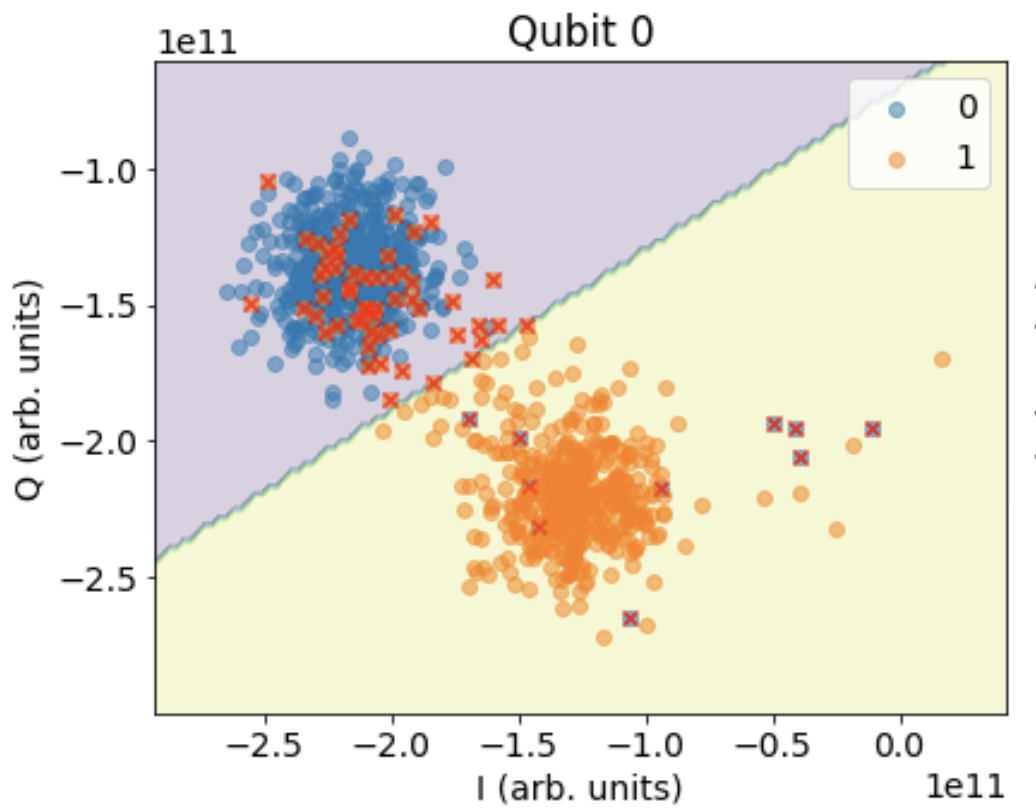
This looks nice! A feature that was useful in Ignis was being able to style the misclassified points with red crosses using a simple flag. Is there an easy way to do that with your plotter class without adding another series to the legend?
Also, plotting the distribution of shots projected to both I and Q axes can be useful for visualizing overlap, maybe that can be an optional visualization flag: |
eggerdj
suggested changes
Oct 18, 2022
|
I like the suggestions in #948 (comment) I think we could also do this in a follow-up PR (this would allow #936 to move forward in parallel to adding the suggested plotting functionality) since this plotting functionality requires a bit more code. From the user's perspective it should be easy to control through options. E.g. |
Sign up for free
to join this conversation on GitHub.
Already have an account?
Sign in to comment
Add this suggestion to a batch that can be applied as a single commit.
This suggestion is invalid because no changes were made to the code.
Suggestions cannot be applied while the pull request is closed.
Suggestions cannot be applied while viewing a subset of changes.
Only one suggestion per line can be applied in a batch.
Add this suggestion to a batch that can be applied as a single commit.
Applying suggestions on deleted lines is not supported.
You must change the existing code in this line in order to create a valid suggestion.
Outdated suggestions cannot be applied.
This suggestion has been applied or marked resolved.
Suggestions cannot be applied from pending reviews.
Suggestions cannot be applied on multi-line comments.
Suggestions cannot be applied while the pull request is queued to merge.
Suggestion cannot be applied right now. Please check back later.
Summary
The recent addition of the visualization module for Qiskit Experiments introduced plotters to the code-base (#902). This PR adds a new plotter subclass for plotting IQ data, typically acquired from experiments with level-1 results or during state-discrimination training (#936).
Details and comments
This PR adds a new
IQPlotterclass to plot IQ data for multiple prepared states and a discriminator which classifies the IQ points into state labels. The plotter takes in points and centroid data for different prepared states and creates a scatter plot with their values. Modifications were made toBaseDrawerandMplDrawerto add functionality to draw an image on a canvas, (i.e., equivalent toplt.imshow).Usage of
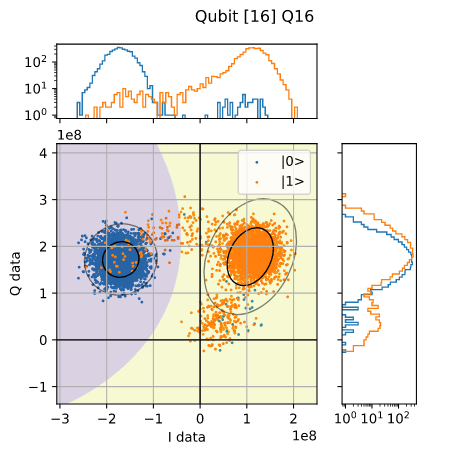
IQPlotter.Below you can see a figure generated using
IQPlotterfor mock qutrit readout. The code used to generate this figure is given at the end of the PR description. The plotting class supports plotting individual points and centroids for multiple states, where states are different series. It also supports plotting the predictions of a trained discriminator over a region of the IQ space. This is done by sampling the discriminatorspredict()method for different IQ positions. The discriminator is passed as supplementary data to the plotter.New
BaseDrawer.image()method.To allow plotters to draw images onto a canvas,
BaseDrawerandMplDrawerhad to be updated with new functionality.BaseDrawer.image()takes in a two-dimensional NumPy array of numerical values or strings, or a three-dimensional NumPy array of RGB/RGBA data. If two-dimensional numerical data is provided, the drawer will assign colours to the values based on thecmapparameter.image()also supports plotting images of classification labels, where the values indataare series names (str). Settingcmap_use_series_colors=Truewill tell the drawer to use the series colours (from other graphics already drawn on the canvas) as the colours for the image. This is used byIQPlotterto plot a discriminators predictions and match the colours to IQ points and centroids.image()also has anextentparameter which defines the region for the image in the units of the X and Y axes.IQPlotteruses a helper classDataExtentCalculatorto assist with precomputing the extent of the plotting data, so that the discriminator can be sampled to generate the prediction image.Example code to generate the example figure.