BUG: legend behaves inconsistently when plotting to the same axes #6678
Conversation
|
@TomAugspurger can you take a look at this? |
|
@sinhrks - you're going to need to rebase this before we can merge it. |
|
ok, rebased. |
pandas/tools/plotting.py
Outdated
There was a problem hiding this comment.
I think the and not self.label is None is redundant. If self.label is set to None then label becomes None, which is the same as your else. So this could be
if self.legend and hasattr(self, 'label'):
    label = self.label
else:
    label = None
unless I'm missing something.
|
This will technically cause the test suite fail if someone runs the slow tests on py2.6 since the |
|
Other than that, this should be fine. @sinhrks I'll get to your area plot PR soon. |
|
hmmm....could enable slow ops on 2.6 (as it skips other things)....let me see |
|
OK. @sinhrks do you mind changing the asserts in @sinhrks I didn't realize it was already broken before your PR . Could you change the one at the bottom of |
|
hmm..current plotting DOES seem ok on 2.6 see here: https://travis-ci.org/jreback/pandas/jobs/22479235 (this with matplotlib 1.3.1). am thinking about putting this in master - ownly drawback as this now takes a fair amount of time more than the other runs (master is about 50% faster than these anyhow because of caching). worth it? |
|
I'm not sure if it's worth it for this specific issue. The actual code is valid python 2.6+, it's just the tests that rely on 2.7+ methods. But if you have other reasons for running the slow ones on 2.6 then go for it. |
|
@TomAugspurger no...going to pass on the 2.6 slow for now...doesn't seem worth it.... go ahead on this PR when you are ready |
|
Sure, I've modified condition formula and remove Also, followings are changed:
|
doc/source/release.rst
Outdated
There was a problem hiding this comment.
This can be removed when you rebase.
|
@sinhrks reviewing this today. Sorry it took so long. Would you mind rebasing on top of master? (last time, I promise) I'll get this one merged, then you can rebase your Area one on top of this and we can merge that too. Could you also clean up the docs now that the legend API is so much better?
You can pass I think you can remove the since The rest should be good. You could add a reversed example too if you want, |
|
@TomAugspurger Sure. Modified docs and rebased. I agree that reversed example in the doc is not necessary. |
BUG: legend behaves inconsistently when plotting to the same axes
|
Thanks! Ahh I may have been a bit quick on merging. I'll keep my eye on what Travis says https://travis-ci.org/pydata/pandas/builds/23507773 |
|
Travis is all green: https://travis-ci.org/pydata/pandas/builds/23507773 |
There seems to be some inconsistencies related to
DataFrame.plotandSeries.plotlegend behaviors.Problems:
DataFrame.plotorSeries.plotplots data on the same axes repeatedly:legendkw and existing legend will be drawn as line artist regardless of actual artist type. Also, legend cannot bereverseed if the axes already has a legend.reverseto all artists including the existing one.subplotsis enabled, line plot draws legends on each axes but bar plot doesn't.labelkeyword is passed.Fix:
I've prepared a fix based on following concept, except
hexbinwhich doesn't use legend.legendvalue.legend=Trueand df2 withlegend=False, only df1's legend should appear.legend='reverse'd, only df2's legend should be reversed.subplots=Trueandlegend=True, each subplot axes should have its own legend (standardize current line plot behavior).Example Code
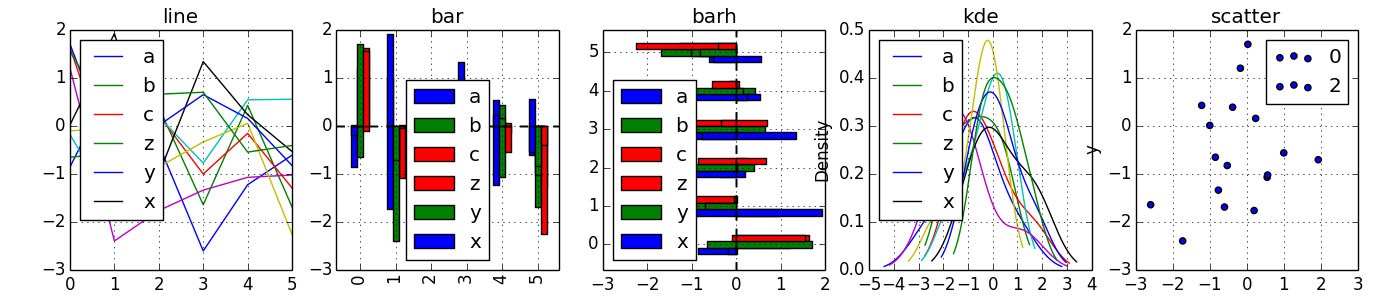
Output using current repository
a, b, c, z, y x. Because df2 was plot bylegend=False, and df3 was plot bylegend='reverse'.0, 2is expected because df2 was plot bylegend=False.Output after fix
If there is anything should be considered, please let me know. Thanks.