feat: Add integration for parsing GNU-style backtrace dumps #288
Conversation
This file contains hidden or bidirectional Unicode text that may be interpreted or compiled differently than what appears below. To review, open the file in an editor that reveals hidden Unicode characters.
Learn more about bidirectional Unicode characters
|
I wonder if we can share this code across SDKs somehow. There's nothing in this integration that couldn't apply to nodejs or C#. I considered writing it in Haxe. |
|
@bruno-garcia adding you because of what we discussed the last retros about SDK work. |
|
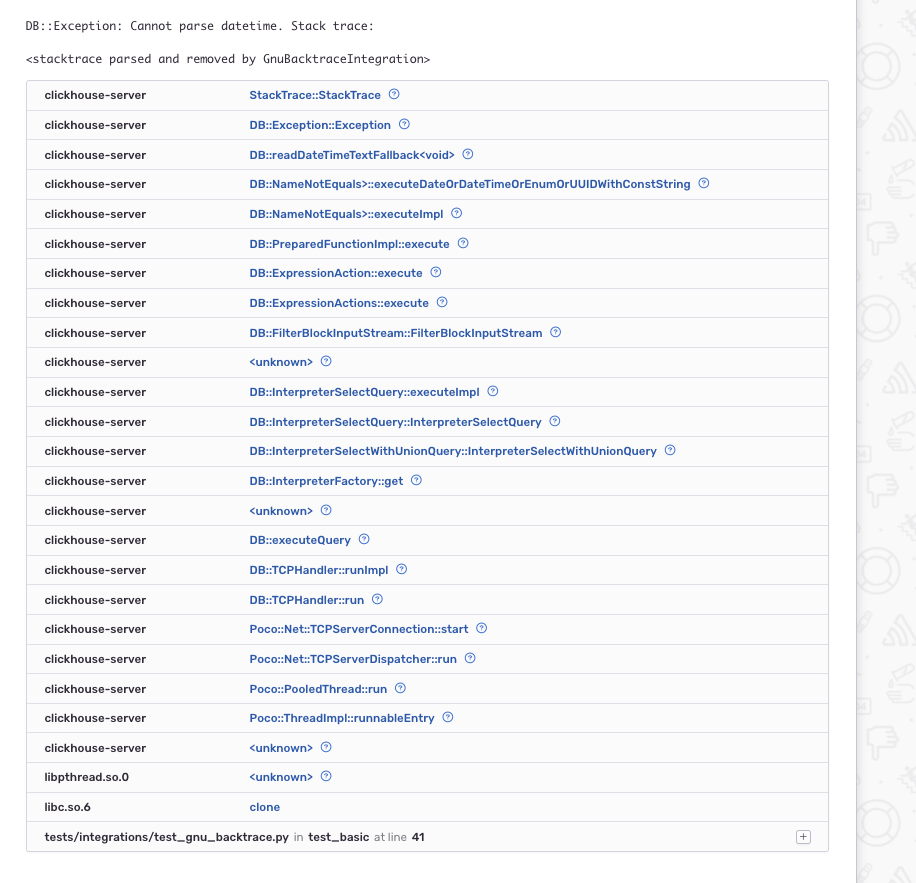
@untitaker do you have a screenshot of what it looks like in Sentry the mix callstack? If you do, could you paste in the PR, please? |
|
@mitsuhiko reminded me to set platform to native, will fix |
|
@untitaker we ahve new stacktrace rendering now? :) |
|
@bruno-garcia I updated the screenshot |
|
One shitty aspect of this right now is that every frame is annotated as inline frame because there are no instruction addrs |
|
@untitaker We can change that quite easily. Should actually. |
bruno-garcia
approved these changes
Mar 18, 2019
sentrivana
pushed a commit
that referenced
this pull request
Jul 22, 2025
This integration was added back in 2019
#288 but I think since
then the stack trace from clickhouse driver has changed, anyway I tried
to update it so that it parses the stack trace again
Sign up for free
to join this conversation on GitHub.
Already have an account?
Sign in to comment
Add this suggestion to a batch that can be applied as a single commit.
This suggestion is invalid because no changes were made to the code.
Suggestions cannot be applied while the pull request is closed.
Suggestions cannot be applied while viewing a subset of changes.
Only one suggestion per line can be applied in a batch.
Add this suggestion to a batch that can be applied as a single commit.
Applying suggestions on deleted lines is not supported.
You must change the existing code in this line in order to create a valid suggestion.
Outdated suggestions cannot be applied.
This suggestion has been applied or marked resolved.
Suggestions cannot be applied from pending reviews.
Suggestions cannot be applied on multi-line comments.
Suggestions cannot be applied while the pull request is queued to merge.
Suggestion cannot be applied right now. Please check back later.
Value proposition: ClickHouse sends us error messages with stacktrace information. Ideally we would parse this stacktrace information into actual stacktraces. Here is an integration for exactly that. The testcase is ripped straight from https://sentry.io/organizations/sentry/issues/856036064
ClickHouse calls
backtrace_symbols. It already returns a formatted string/list of strings. ClickHouse then parses this string and replaces symbols with demangled versions. I didn't bother with parsing addresses and offsets as I don't see much value in that information (not sure if it's used in grouping) and some of those return addresses (brackets at the end) seem wrong:I'm open to alternative naming suggestions. As far as I can tell this function has its origins in glibc.
LibExecInfoBacktraceIntegrationseemed bulky. PerhapsGlibcBacktraceIntegrationto avoid conflict with GDB's output format, which seems entirely different? I'm generally unsure ofbacktrace_symbols's origin. It seems to have started as a glibc thing but there are ports for BSD and Darwin. It isn't POSIX though.When discussing the idea of this with @mitsuhiko there was the idea to have a single
NativeStacktraceIntegrationwhere we would add new kinds of stacktrace formats over time. However, in order to not break grouping between minor versions, we can't actually add new variants to that "super-integration" without having the user explicitly opt into each of them (just the same reason why we can't make this a default integration). Therefore I see no point in having one integration for multiple formats, and the naming problem persists.cc @alex-hofsteede