Skip to content

Opencl improvements #579

New issue

Have a question about this project? Sign up for a free GitHub account to open an issue and contact its maintainers and the community.

By clicking “Sign up for GitHub”, you agree to our terms of service and privacy statement. We’ll occasionally send you account related emails.

Already on GitHub? Sign in to your account

Closed
wants to merge 7 commits into from
Closed

Opencl improvements #579

wants to merge 7 commits into from

Conversation

kohrt
Copy link
Contributor

@kohrt kohrt commented Feb 18, 2016

Which this PR includes:

  • Custom Allocator and Frames for OpenCL using pinned memory
  • Removed arrays for tables, instead data is directly written to the OpenCL buffers
  • OpenCL buffers are now created only once on initialization
  • Added definition to enable profiling for the OpenCL kernels
  • Minor improvements for the first stage

With this improvements the OpenCL depth processor takes between 1.09 ms and 1.11 ms on my system, instead of ~2 ms. Most due to the pinned memory.

@kohrt
Copy link
Contributor Author

kohrt commented Feb 18, 2016

Having two tables instead of one is actually slower than to compute them directly. We talked about it here: #222. Or did you meant something else?
Edit: I see, you meant the first commit, but I reverted it later because this improvement wasn't an improvement at all.

@kohrt
Copy link
Contributor Author

kohrt commented Feb 18, 2016

I will update the PR with the suggested changes tomorrow.

@xlz
Copy link
Member

xlz commented Feb 18, 2016

There are two other things. One is PacketProcessor::good() is now the API to propagate errors within packet processors. The specific semantics are not specified yet, but generally when good() returns false, the processor will not be touched anymore.

The other one is please use opencl: Verb some short description as commit subjects then put details in the body.

@xlz
Copy link
Member

xlz commented Feb 18, 2016

When you're done with the PR, please also provide some benchmark results using steps in https://github.com/OpenKinect/libfreenect2/wiki/Performance

Results so far:

Probably all of it has to be redone after your OpenCL optimization.

Thiemo Wiedemeyer added 6 commits February 19, 2016 12:51
…ses on the GPU, they are now precomputed once on the CPU.

Details: Replaced sin(a+b) by sin(a)*cos(b)+cos(a)*sin(b), where sin(a),cos(b),cos(a),sin(b) are stored in a LUT.
Simplyfied processPixelStage1 code and removed processMeasurementTriple.
Moved one if from decodePixelMeasurement to processPixelStage1.
Removed the first part of `valid && any(...)` because valid has been checked before.
…ion.

loadXZTables, loadLookupTable and loadP0TablesFromCommandResponse will now directly write to the OpenCL buffers.
Reverted back to calculating sine and cosine on the GPU.
Usage of LIBFREENECT2_WITH_PROFILING.
Changed CHECK_CL macros.
OpenCLAllocator can now be used for input and output buffers.
OpenCLFrame now uses OpenCLBuffer from allocator.
IMAGE_SIZE and LUT_SIZE as static const.
Added Allocators for input and output buffers.
Moved allocate_opencl to top.
Added good method.
@kohrt
Copy link
Contributor Author

kohrt commented Feb 19, 2016

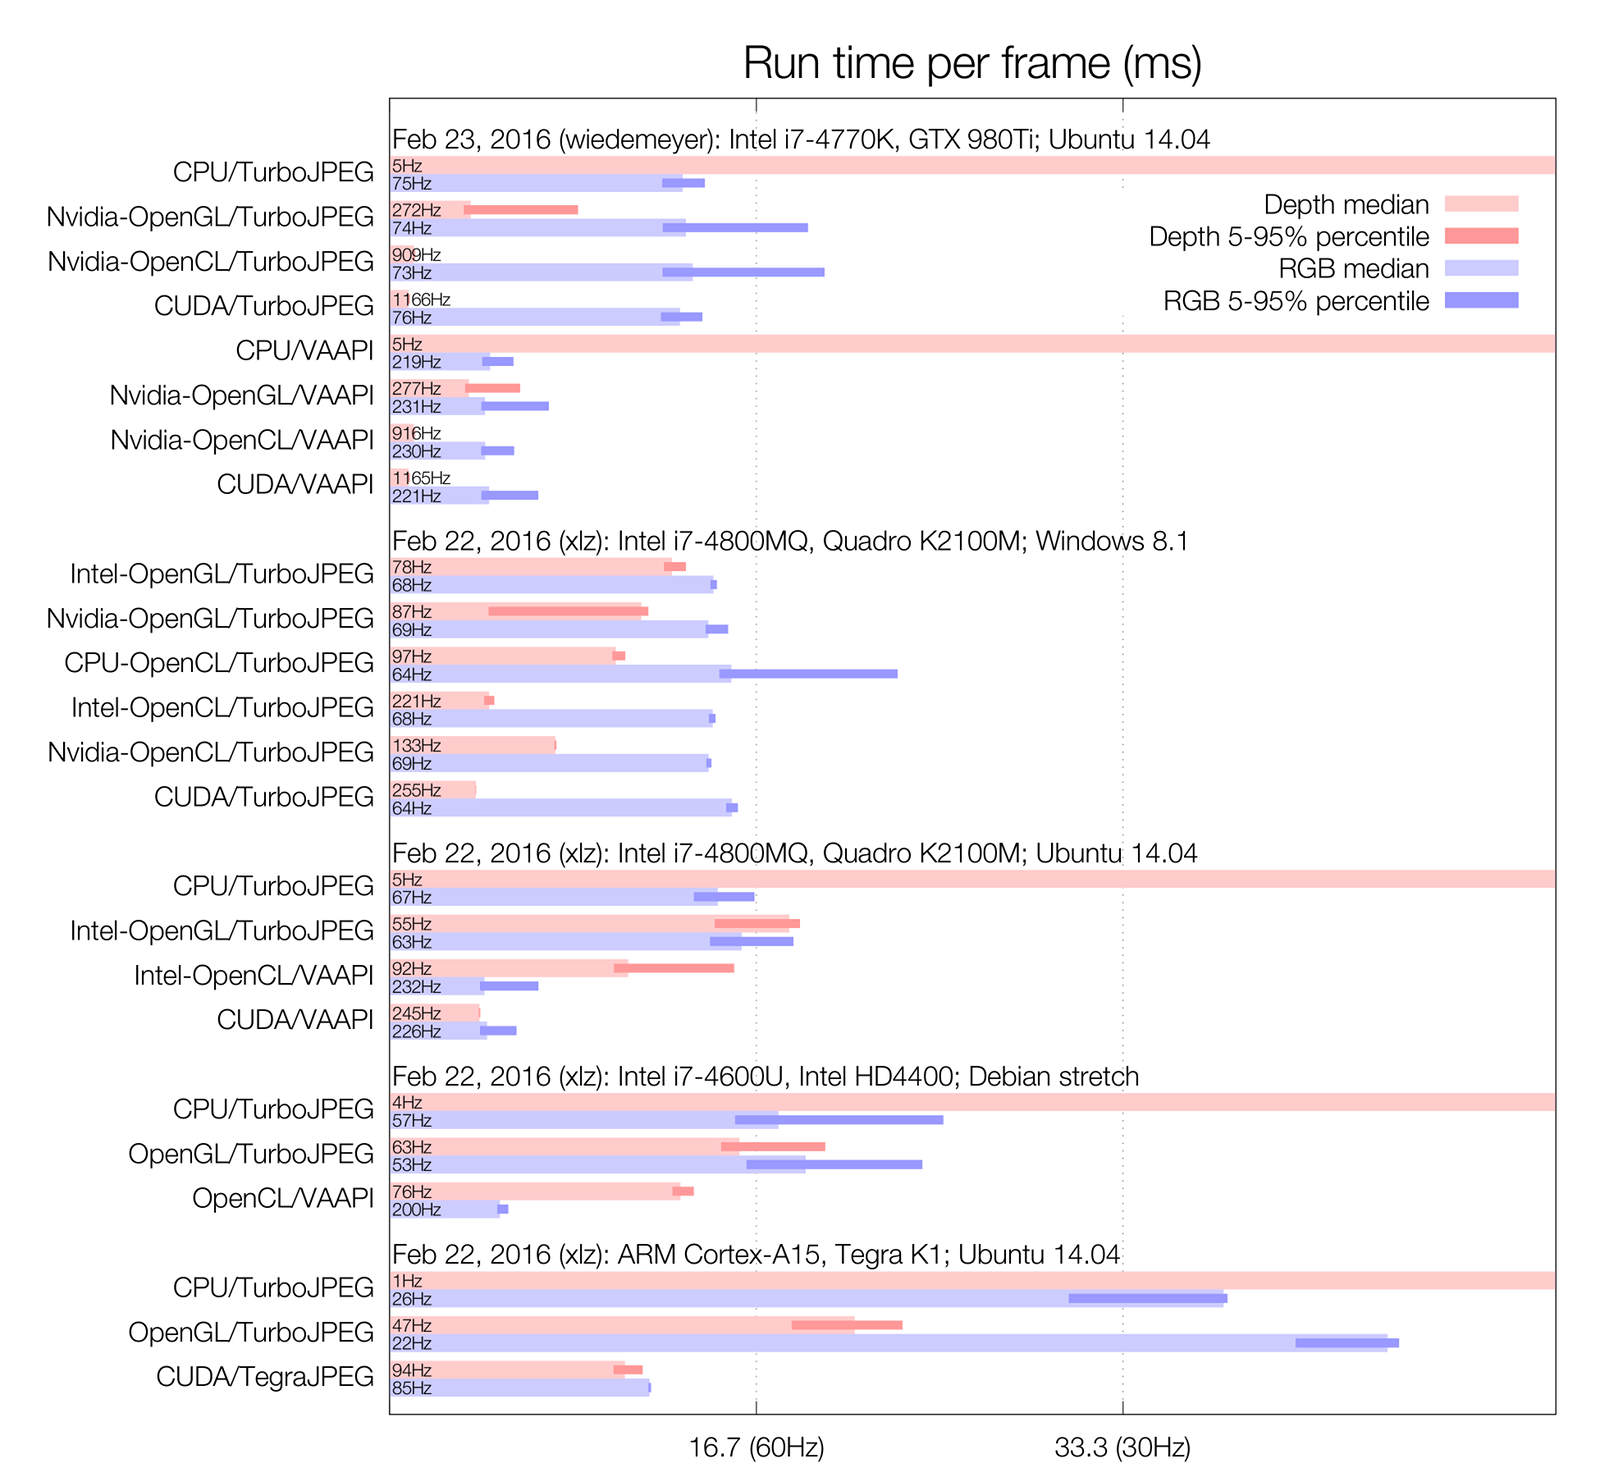
Here are the benchmark results.

ConfigurationDepth (min, 5%, median, 95%, max, mean, std)RGB (min, 5%, median, 95%, max, mean, std)Thread per core usage
Feb 19, 2016: Intel i7-4770K (@4.1GHz), GTX 980Ti; Ubuntu 14.04, kernel 4.2.0-29, gcc 4.8.5
CPU/TurboJPEG194.328 196.617 200.837 212.289 225.055 mean=201.911 std=4.6547512.0173 12.2656 13.1827 19.4198 22.4747 mean=13.6461 std=1.78962CPU:90% TurboJPEG:40% USB:5% Reg:3%
Nvidia-OpenGL/TurboJPEG3.22797 3.36801 8.02571 9.06995 108.705 mean=7.09752 std=2.9641111.9735 12.2769 13.5689 19.4342 28.3156 mean=14.3881 std=2.23828OpenGL:26% TurboJPEG:44% USB:6% Reg:20%
Nvidia-OpenCL/VAAPI1.07144 1.08136 1.0924 1.145 2.46014 mean=1.1035 std=0.05999534.14765 4.1658 4.66865 7.72171 11.1335 mean=4.98485 std=1.18519OpenCL:3% VAAPI:2% USB:6% Reg:18%
CUDA/VAAPI0.857415 0.861542 0.868286 0.924719 3.31855 mean=0.882014 std=0.06996964.12401 4.14701 4.6825 10.9971 11.2794 mean=5.18491 std=1.60745CUDA:5% VAAPI:2% USB:6% Reg:22%

Enabling profiling in OpenCL effects the performance, so for profiling libfreenect2s processors, it should be disabled and only used when testing improvements of the OpenCL code itself.
@kohrt
Copy link
Contributor Author

kohrt commented Feb 19, 2016

I added all the recommended changes except the p0_table array as a class member, I changed it to dynamically allocated memory, because p0_table is just used once and then never again.
The rebase of the fork to the upstream master seems to have removed the comments on the commits, sorry for that.

@xlz
Copy link
Member

xlz commented Feb 19, 2016

Which GPU (Intel or Nvidia) did the OpenCL case use? (Hopefully both Intel and Nvidia GPUs can be tested with OpenCL)

@kohrt
Copy link
Contributor Author

kohrt commented Feb 19, 2016

Nvidia, i edited the previous post.

@xlz
Copy link
Member

xlz commented Feb 19, 2016

I reviewed some of the changes. There is a lot of back and forth so it's no longer practical to reorganize this into standalone functional patches. I'll merge the code as-is but will format the subjects and commit messages.

Do you want to add something in CMakeLists.txt to turn on LIBFREENECT2_WITH_PROFILING_CL more easily or revert it to a file-level macro like #ifdef PROFILE_CL which can only be enabled by developer editing CMakelists.txt? I suppose you didn't turn it on during the benchmarking?

@xlz
Copy link
Member

xlz commented Feb 19, 2016

I have added your results to the wiki (Do you have permissions to edit it?).

Also after reviewing your patches I realize the CUDA processor still lacks some of the improvement you added here, good catches.

@kohrt
Copy link
Contributor Author

kohrt commented Feb 20, 2016

The back and forth wasn't intended.
We could add setting the definition to the CMakeLists, but I don't think it is important, because nearly nobody will use it. I just wanted the code to be there in case of further improvements. I am ok with putting a #define LIBFREENECT2_WITH_PROFILING_CL (or however we name it) in the source code to enable profiling. And yes I disabled the CL profiling, when profiling the processors.
I think I can edit the wiki, there is an edit button, but I haven't tried to change anything yet. I can also benchmark some other combinations next week if needed. It would also be great, if the profiling would measure the CPU utilization of the threads itself, rather then trying to find a good average from the top output.

@xlz
Copy link
Member

xlz commented Feb 20, 2016

You can add the benchmark results directly to the wiki next time.

I'll try to add the per core usage stats programmatically.

@xlz
Copy link
Member

xlz commented Feb 21, 2016

Well, per core usage is not that important. Adding the stats is quite intrusive so I give up.

@xlz
Copy link
Member

xlz commented Feb 21, 2016

Manually merged.

If you don't feel like it, just ignore and not collect the per core usage. So far it is only useful in identifying the memory access on Tegra is extremely slow.

@xlz xlz closed this Feb 21, 2016
@xlz
Copy link
Member

xlz commented Feb 22, 2016

@wiedemeyer Can you run the CUDA test again? Hopefully VAAPI will have smaller variance.

@kohrt kohrt deleted the opencl_improvements branch February 23, 2016 08:38
@kohrt
Copy link
Contributor Author

kohrt commented Feb 23, 2016

yes, I will run it this afternoon.

@kohrt
Copy link
Contributor Author

kohrt commented Feb 23, 2016

@xlz
I profiled all combinations and put the results into the wiki. I also created the gnuplot image, but I don't know where and how to replace the current one.

But there is something wrong with the CUDA processor. When I run VAAPI with CUDA Protonect uses ~70% CPU, that is much compared to OpenCL with only ~33% CPU, or OpenGL with ~41% CPU. The CPU usage refers to the usage of the whole process as show by htop. You can also see that in the results from the profiling in the wiki.

@xlz
Copy link
Member

xlz commented Feb 23, 2016

I'll render the image.

According the your usage data, only the registration in the main thread has unusual CPU usage. It's weird. There really is nothing special in the registration routines. I'll take a look at what's going on on my side. You can check too.

@kohrt
Copy link
Contributor Author

kohrt commented Feb 24, 2016

I ran kinect2_bidge and subscribed to /kinect2/sd/camera_info. This way the kinect2_bridge does nearly nothing, except starting capturing data through libfreenect2 and publishing the camera_info. There it made no difference between using OpenCL or Cuda. The CPU usage of the whole process was just 12%. Why would Protonect without a viewer take so much more resources, can it be the profiling? I don't have much time now to look into it, but maybe later.

@xlz
Copy link
Member

xlz commented Feb 24, 2016

The slowness in Registration is caused by a wrong write combined flag used in CUDA. Fixed in 18d1cff

This fix doesn't seem to have significant effect on performance in CUDA or VAAPI.

@kohrt
Copy link
Contributor Author

kohrt commented Feb 25, 2016

But it fixed the high CPU load with CUDA. I updated the CPU usage in my wiki performance entries.

Sign up for free to join this conversation on GitHub. Already have an account? Sign in to comment
Labels
None yet
Projects
None yet
Development

Successfully merging this pull request may close these issues.

2 participants