-
Notifications
You must be signed in to change notification settings - Fork 234
Description
Description of the desired feature
Following on from #464, we'll need help adding a gallery/tutorial on how to pass in datetime inputs to plot!
Simple goal (gallery example):
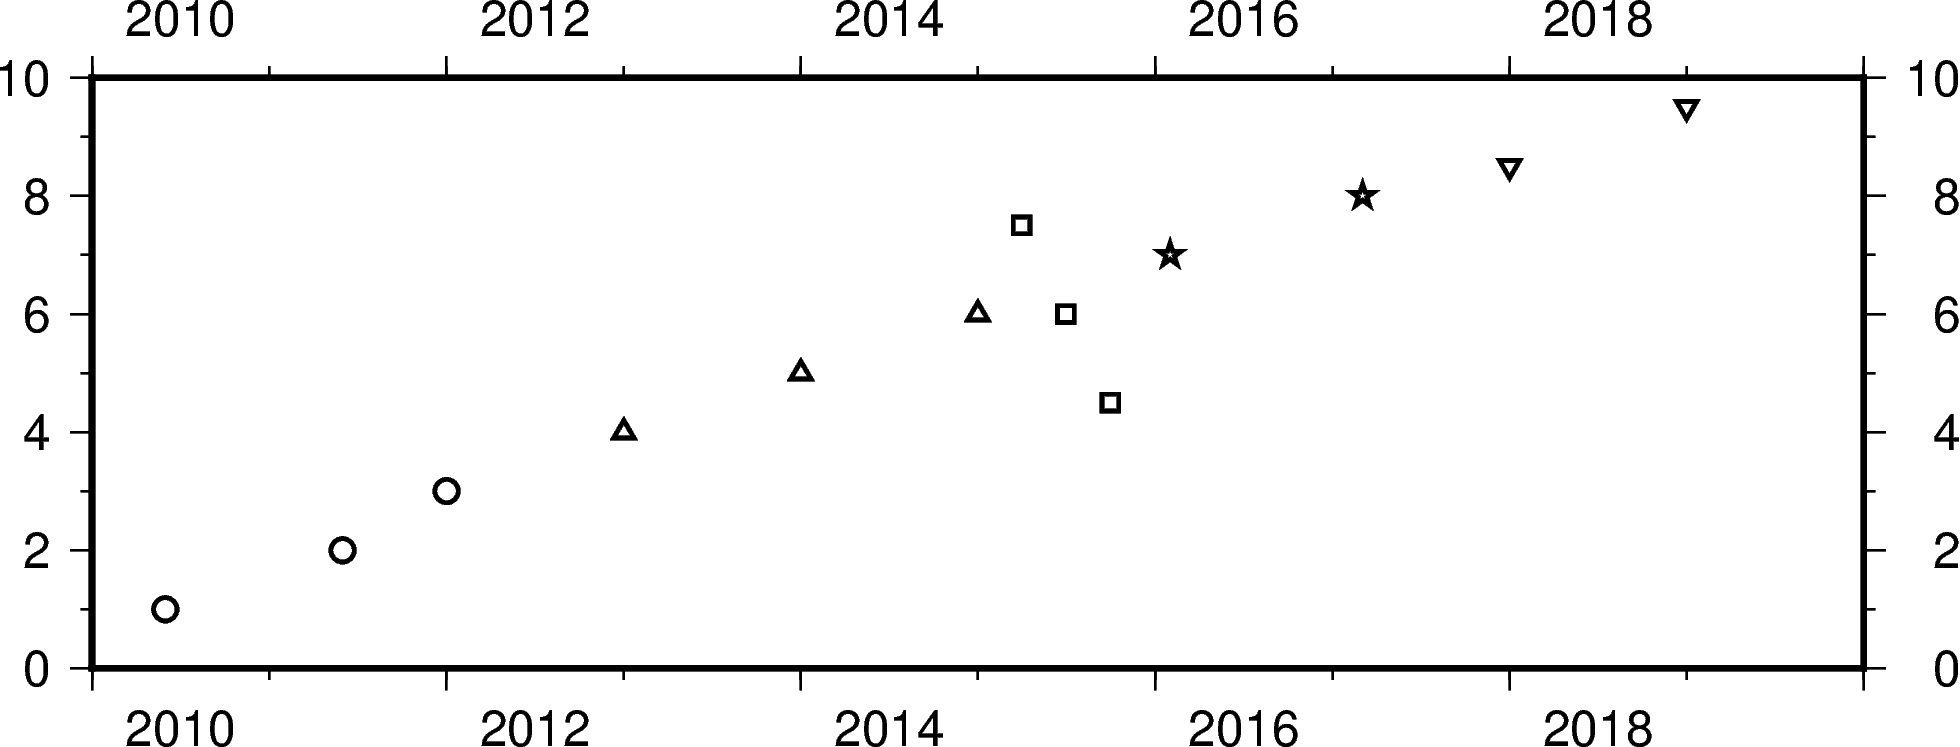
Start by taking a look at the top post of #464. The example should cover at least 4 types of Python datetime inputs:
- numpy.datetime64
- pandas.DateTimeIndex
- Raw datetime strings in both ISO and non-ISO formats, e.g.,
2010-01-01,1/1/2018,Jul 5, 2019 - Python's built-in datetime and date
You can adapt the example from the following code:
pygmt/pygmt/tests/test_plot.py
Lines 294 to 325 in a2258a5
| def test_plot_datetime(): | |
| """Test various datetime input data""" | |
| fig = Figure() | |
| fig.basemap(projection="X15c/5c", region="2010-01-01/2020-01-01/0/10", frame=True) | |
| # numpy.datetime64 types | |
| x = np.array( | |
| ["2010-06-01", "2011-06-01T12", "2012-01-01T12:34:56"], dtype="datetime64" | |
| ) | |
| y = [1.0, 2.0, 3.0] | |
| fig.plot(x, y, style="c0.2c", pen="1p") | |
| # pandas.DatetimeIndex | |
| x = pd.date_range("2013", freq="YS", periods=3) | |
| y = [4, 5, 6] | |
| fig.plot(x, y, style="t0.2c", pen="1p") | |
| # xarray.DataArray | |
| x = xr.DataArray(data=pd.date_range(start="2015-03", freq="QS", periods=3)) | |
| y = [7.5, 6, 4.5] | |
| fig.plot(x, y, style="s0.2c", pen="1p") | |
| # raw datetime strings | |
| x = ["2016-02-01", "2017-03-04T00:00"] | |
| y = [7, 8] | |
| fig.plot(x, y, style="a0.2c", pen="1p") | |
| # the Python built-in datetime and date | |
| x = [datetime.date(2018, 1, 1), datetime.datetime(2019, 1, 1)] | |
| y = [8.5, 9.5] | |
| fig.plot(x, y, style="i0.2c", pen="1p") | |
| return fig |
It would also be good to show how datetime-like arguments can be passed in the 'region' argument of fig.basemap, see #562.
Stretch goal (full tutorial)
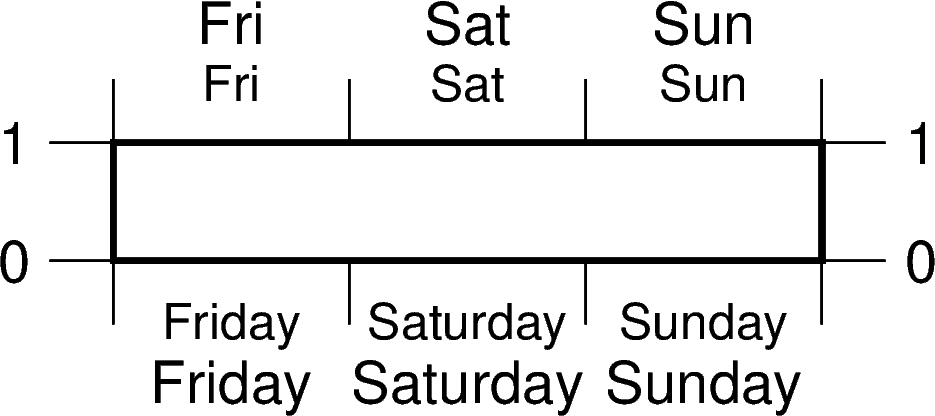
Learn how to use pygmt.config to configure Calendar/Time Parameters!
This is a bit more involved, but you can do amazing stuff like abbreviate Sunday to Sun. Example code/figure:
pygmt/pygmt/tests/test_config.py
Lines 77 to 90 in a2258a5
| def test_config_format_time_map(): | |
| """ | |
| Test that setting `FORMAT_TIME_MAP` config changes both | |
| `FORMAT_TIME_PRIMARY_MAP` and `FORMAT_TIME_SECONDARY_MAP`. | |
| """ | |
| fig = Figure() | |
| with config(FORMAT_TIME_MAP="abbreviation"): | |
| fig.basemap( | |
| region=["2020-1-24T", "2020-1-27T", 0, 1], | |
| projection="X6c/1c", | |
| frame=["pa1K", "sa1K", "NWse"], | |
| ) | |
| fig.basemap(frame=["pa1K", "sa1K", "nwSE"]) | |
| return fig |
See also GMT Gallery Example 21 "Time-series of RedHat stock price" at https://docs.generic-mapping-tools.org/6.1/gallery/ex21.html for what is possible!
Are you willing to help implement and maintain this feature? Let's have someone new tackle this!

