Skip to content

Conversation

@adinn
Copy link
Collaborator

@adinn adinn commented Jun 7, 2022

This PR is the promised cleanup to the debug info generator that ensures the model of the class base used to drive debug info generation is built by identifying TypeEntry and MethodEntry records using ResolvedJavaClass and ResolvedJavaMethod instances rather than their associated names. This means the model can cope with multiple types that have the same name and cope with multiple methods attached to some given class that have the same name and signature.

The cleanup also modifies the Dwarf Properties model that associates Dwarf section offsets and other information with a TypeEntry, MethodEntry or Range. Properties records are still stored in hash tables. However, the hash tables are now keyed using the Type/MethodEntry objects rather than the type/method names. Also method Properties are stored in one top level hash table rather than being nested in hash tables embedded in the type Properties.

n.b. the properties model really needs a further cleanup to allow the properties to be hung directly off the TypeEntry, MethodEntry or Range rather than indexed using an auxiliary hash table. That will be addressed in a follow-up PR.

@adinn
Copy link
Collaborator Author

adinn commented Jun 7, 2022

Fix for issue #4626

@adinn adinn requested review from olpaw and zakkak June 7, 2022 11:26
Copy link
Collaborator

@zakkak zakkak left a comment

Choose a reason for hiding this comment

The reason will be displayed to describe this comment to others. Learn more.

LGTM other than some minor comments.

Thank you @adinn for this refactoring/cleanup!

} else {
return kind.getJavaName();
}
return valueType().toJavaName();
Copy link
Collaborator

Choose a reason for hiding this comment

The reason will be displayed to describe this comment to others. Learn more.

valueType() has a check for type != null which means that it could potentially return null and that null value will not be handled here resulting in a crash.

Copy link
Collaborator Author

Choose a reason for hiding this comment

The reason will be displayed to describe this comment to others. Learn more.

Yes, indeed. I have modified it to return an empty string if valueType() returns null.

}

NativeImageDebugLocalValueInfo(String name, JavaValue value, int framesize, JavaKind kind, ResolvedJavaType type, int slot, int line) {
NativeImageDebugLocalValueInfo(String name, JavaValue value, int framesize, JavaKind kind, ResolvedJavaType t, int slot, int line) {
Copy link
Collaborator

Choose a reason for hiding this comment

The reason will be displayed to describe this comment to others. Learn more.

Suggested change
NativeImageDebugLocalValueInfo(String name, JavaValue value, int framesize, JavaKind kind, ResolvedJavaType t, int slot, int line) {
NativeImageDebugLocalValueInfo(String name, JavaValue value, int framesize, JavaKind kind, ResolvedJavaType type, int slot, int line) {

This should better be kept named as type for consistency.

Copy link
Collaborator Author

Choose a reason for hiding this comment

The reason will be displayed to describe this comment to others. Learn more.

Well, yes but I got a style check error because it shadows field type. I have renamed it to resolvedType.

Comment on lines 927 to 928
// } else if (targetMethod instanceof CustomSubstitutionMethod) {
// targetMethod = ((CustomSubstitutionMethod) targetMethod).getOriginal();
Copy link
Collaborator

Choose a reason for hiding this comment

The reason will be displayed to describe this comment to others. Learn more.

Are these commented out by mistake?

Copy link
Collaborator Author

Choose a reason for hiding this comment

The reason will be displayed to describe this comment to others. Learn more.

This was deliberate and the comments have now been removed.

*/
if (superClass != null) {
return getDeclaringClass(superClass, true).toJavaName();
return getDeclaringClass(superClass, true);
Copy link
Collaborator

Choose a reason for hiding this comment

The reason will be displayed to describe this comment to others. Learn more.

Suggested change
return getDeclaringClass(superClass, true);
return getOriginal(superClass);

for consistency and to avoid an indirection

return m;
}

private ResolvedJavaMethod originalMethod() {
Copy link
Collaborator

Choose a reason for hiding this comment

The reason will be displayed to describe this comment to others. Learn more.

This is a duplicate of private static ResolvedJavaMethod getOriginal(HostedMethod hostedMethod)

Copy link
Collaborator Author

Choose a reason for hiding this comment

The reason will be displayed to describe this comment to others. Learn more.

No, it's not exactly the same and the difference is very important.

This method is used to compute the /identity/ for a method presented anywhere in the DebugInfoProvider API. It unwraps from the Hosted domain to the JVMCI domain so that we ensure we get the same method whether the NativeImage or CodeCache presents it as a Hosted value or an original JVMCI value.

In the one special case of a SubstitutionMethod we traverse to the /original/ method. That ensures we consistently identify a substitution Bar.bar <--@Sub-- Foo.foo with method foo, not method bar. We need to do that so that in the type info model we only have the one method foo declared in the one class Foo. The debugger has to see a single, consistent view of the class and method. We don't want to see a method called bar attached to class Foo in one context and a method called foo attached to Foo in another context (and we certainly don't want to see a method called bar attached to class Bar). In fact we don't want to see class Bar referenced at all in the debug info type model (although we do want to see the file and source code for Bar.bar when debugging).

The only other case where we don't unwrap to a JVMCI method is when we hit some other form of substitution. In that case we use the unwrapped method is our id method. We don't ever traverse to the original here even when, in some cases, we can do so. That's for two reasons. Firstly, for custom substitutions the original is not normally of any relevance. The method code is synthesized, which means the original's file and bytecode is irrelevant. Secondly, the original may actually exist as a method in its own right, listed as belonging to the declaring class (this happens with custom substitution cases for foreign stub methods and reflective methods). If we used the original to identify the substitution we would end up conflating two or more independent methods (the debug model type scan detects this, generating an error because the same method is notified twice).

Method getOriginal(HostedMethod) (now renamed as getAnnotatedOrOriginal(HostedMethod)) is only used when determining a method's file or permissions. It also unwraps from the Hosted domain to the JVMCI domain. The difference is that in the special case of a SubstitutionMethod it traverses to the /annotated/ method. That's needed for file lookup because the correct file needs to be derived from the declaring class of the annotated method. It's also necessary as far as permissions are concerned because the compiler compiles the bytecode from the /annotated/ method so generates code whose permissions are determined by that bytecode.

Copy link
Collaborator

Choose a reason for hiding this comment

The reason will be displayed to describe this comment to others. Learn more.

Thanks for the clarification Andrew. I missed the difference in my first pass.

String paramName = paramInfo.name();
String paramTypeName = paramInfo.typeName();
TypeEntry paramType = lookupType(paramInfo.valueType());
String paramTypeName = paramType.getTypeName();
Copy link
Collaborator

Choose a reason for hiding this comment

The reason will be displayed to describe this comment to others. Learn more.

Nitpick: Since paramTypeName is only used in the log calls I would inline it.

Copy link
Collaborator Author

Choose a reason for hiding this comment

The reason will be displayed to describe this comment to others. Learn more.

Done. I also did the same with 2 occurrences of local var valueTypeName and one of local var returnTypeName that were only used in log statements.

/* Add details of fields and field types */
debugArrayTypeInfo.fieldInfoProvider().forEach(debugFieldInfo -> this.processField(debugFieldInfo, debugInfoBase, debugContext));
debugContext.log("typename %s element type %s base size %d length offset %d\n", typeName, elementTypeName, baseSize, lengthOffset);
debugContext.log("typename %s element type %s base size %d length offset %d\n", typeName, this.elementType.getTypeName(), baseSize, lengthOffset);
Copy link
Collaborator

Choose a reason for hiding this comment

The reason will be displayed to describe this comment to others. Learn more.

I see that in other log messages the canonicalized name is used instead. I would suggest either using the canonicalized name everywhere or nowhere to keep things consistent.

Copy link
Collaborator Author

Choose a reason for hiding this comment

The reason will be displayed to describe this comment to others. Learn more.

This was ensuring that spaces in names were replaced with underscores. We no longer need to do this name correction so I have removed all calls.

@olpaw olpaw self-assigned this Jun 7, 2022
@olpaw olpaw changed the title Debug id cleanup [GR-39018] Debug id cleanup Jun 7, 2022
@olpaw
Copy link
Member

olpaw commented Jun 7, 2022

Please pretty up the commit messages. Maybe fold the last 4 style related commits into one.

* 1b2bfb8d6ec - (2 hours ago) fix more style check errors - Andrew Dinn (HEAD -> adinn/debug_id_cleanup, origin/debug_id_cleanup)
* 9cee0d7f560 - (4 hours ago) bypass incoherent style check errors - Andrew Dinn
* 2d48445f96d - (21 hours ago) more style fixes - Andrew Dinn
* 612a950a4d0 - (22 hours ago) style fixes - Andrew Dinn
* 939702fe5b7 - (23 hours ago) Ensure methods are identified using their originating ResolvedJavaMethod rather than their symbol name. - Andrew Dinn
* 84501758bbb - (8 days ago) Ensure classes are identified using their originating ResolvedJavaClass rather than via class names. - Andrew Dinn

@adinn adinn force-pushed the debug_id_cleanup branch from e79a4b7 to e16413a Compare June 8, 2022 13:48
@adinn
Copy link
Collaborator Author

adinn commented Jun 8, 2022

@olpaw @zakkak I have just force pushed an update that addresses all the review comments and squashes the commits down to something minimal and coherent. The push pre-squash passed all the gate tests so I think this is good to go for internal gate testing -- assuming you are happy with the corrections.

@olpaw olpaw self-requested a review June 8, 2022 14:46
Copy link
Member

@olpaw olpaw left a comment

Choose a reason for hiding this comment

The reason will be displayed to describe this comment to others. Learn more.

Looks good. Running in our CI now ...

@olpaw
Copy link
Member

olpaw commented Jun 8, 2022

@adinn, with micronaut and spring image builds I see stacktraces with your changes. They all look the same:

[3/7] Building universe...                                                                               (2.9s @ 1.94GB)
[4/7] Parsing methods...      [*]                                                                        (2.0s @ 4.45GB)
[5/7] Inlining methods...     [***]                                                                      (0.9s @ 2.35GB)
[6/7] Compiling methods...    [***]                                                                      (9.0s @ 2.32GB)

[7/7] Creating image...                                                                                  (0.0s @ 4.02GB)
Fatal error: com.oracle.svm.core.util.VMError$HostedError: java.lang.NullPointerException
	at com.oracle.svm.core.util.VMError.shouldNotReachHere(VMError.java:72)
	at com.oracle.svm.hosted.image.NativeImage.write(NativeImage.java:181)
	at com.oracle.svm.hosted.image.NativeImageViaCC.write(NativeImageViaCC.java:97)
	at com.oracle.svm.hosted.NativeImageGenerator.doRun(NativeImageGenerator.java:702)
	at com.oracle.svm.hosted.NativeImageGenerator.run(NativeImageGenerator.java:519)
	at com.oracle.svm.hosted.NativeImageGeneratorRunner.buildImage(NativeImageGeneratorRunner.java:407)
	at com.oracle.svm.hosted.NativeImageGeneratorRunner.build(NativeImageGeneratorRunner.java:585)
	at com.oracle.svm.hosted.NativeImageGeneratorRunner.main(NativeImageGeneratorRunner.java:128)
	at com.oracle.svm.hosted.NativeImageGeneratorRunner$JDK9Plus.main(NativeImageGeneratorRunner.java:615)
Caused by: java.lang.NullPointerException
	at com.oracle.objectfile.debugentry.Range.addVarRanges(Range.java:387)
	at com.oracle.objectfile.debugentry.Range.updateVarRangeMap(Range.java:369)
	at com.oracle.objectfile.debugentry.Range.getVarRangeMap(Range.java:360)
	at com.oracle.objectfile.elf.dwarf.DwarfLocSectionImpl.writeTopLevelLocations(DwarfLocSectionImpl.java:180)
	at com.oracle.objectfile.elf.dwarf.DwarfLocSectionImpl.writePrimaryRangeLocations(DwarfLocSectionImpl.java:170)
	at com.oracle.objectfile.elf.dwarf.DwarfLocSectionImpl.writeMethodLocations(DwarfLocSectionImpl.java:163)
	at com.oracle.objectfile.elf.dwarf.DwarfLocSectionImpl.lambda$writePrimaryClassLocations$0(DwarfLocSectionImpl.java:140)
	at java.base/java.util.stream.ReduceOps$1ReducingSink.accept(ReduceOps.java:80)
	at java.base/java.util.stream.ReferencePipeline$2$1.accept(ReferencePipeline.java:177)
	at java.base/java.util.ArrayList$ArrayListSpliterator.forEachRemaining(ArrayList.java:1655)
	at java.base/java.util.stream.AbstractPipeline.copyInto(AbstractPipeline.java:484)
	at java.base/java.util.stream.AbstractPipeline.wrapAndCopyInto(AbstractPipeline.java:474)
	at java.base/java.util.stream.ReduceOps$ReduceOp.evaluateSequential(ReduceOps.java:913)
	at java.base/java.util.stream.AbstractPipeline.evaluate(AbstractPipeline.java:234)
	at java.base/java.util.stream.ReferencePipeline.reduce(ReferencePipeline.java:563)
	at com.oracle.objectfile.elf.dwarf.DwarfLocSectionImpl.writePrimaryClassLocations(DwarfLocSectionImpl.java:137)
	at com.oracle.objectfile.elf.dwarf.DwarfLocSectionImpl.generateContent(DwarfLocSectionImpl.java:129)
	at com.oracle.objectfile.elf.dwarf.DwarfLocSectionImpl.createContent(DwarfLocSectionImpl.java:104)
	at com.oracle.objectfile.elf.dwarf.DwarfSectionImpl.getOrDecideSize(DwarfSectionImpl.java:541)
	at com.oracle.objectfile.elf.ELFUserDefinedSection.getOrDecideSize(ELFUserDefinedSection.java:105)
	at com.oracle.objectfile.ObjectFile.bake(ObjectFile.java:1625)
	at com.oracle.objectfile.ObjectFile.write(ObjectFile.java:1269)
	at com.oracle.svm.hosted.image.NativeImage.lambda$write$0(NativeImage.java:177)
	at com.oracle.objectfile.ObjectFile.withDebugContext(ObjectFile.java:1801)
	at com.oracle.svm.hosted.image.NativeImage.write(NativeImage.java:176)
	... 7 more

If needed, I can provide a reproducer for you tomorrow.

@adinn
Copy link
Collaborator Author

adinn commented Jun 9, 2022

If needed, I can provide a reproducer for you tomorrow.

Yes, that would be very helpful. The NPE follows an assert that the relevant value is null i.e. a presumed invariant is not being met. I'm not clear how that is happening (since it is not supposed to happen). A reproducer will make tracking it down much easier

@olpaw
Copy link
Member

olpaw commented Jun 9, 2022

If needed, I can provide a reproducer for you tomorrow.

Yes, that would be very helpful. The NPE follows an assert that the relevant value is null i.e. a presumed invariant is not being met. I'm not clear how that is happening (since it is not supposed to happen). A reproducer will make tracking it down much easier

Ok. I will provide that early next week.

@olpaw
Copy link
Member

olpaw commented Jun 14, 2022

@adinn I have a reproducer. Unfortunately it's only failing sometimes (~ 1 out of 5)

cd graal/vm
mx --env ni-ce --strip-jars build
mx --env ni-ce --strip-jars benchmark shopcart-wrk:mixed-medium -- --jvm=native-image --jvm-config=default-ce

This will fail with

Fatal error: com.oracle.svm.core.util.VMError$HostedError: java.lang.NullPointerException: Cannot invoke "java.util.List.add(Object)" because "varRanges" is null
	at com.oracle.svm.core.util.VMError.shouldNotReachHere(VMError.java:72)
	at com.oracle.svm.hosted.image.NativeImage.write(NativeImage.java:181)
	at com.oracle.svm.hosted.image.NativeImageViaCC.write(NativeImageViaCC.java:97)
	at com.oracle.svm.hosted.NativeImageGenerator.doRun(NativeImageGenerator.java:700)
	at com.oracle.svm.hosted.NativeImageGenerator.run(NativeImageGenerator.java:517)
	at com.oracle.svm.hosted.NativeImageGeneratorRunner.buildImage(NativeImageGeneratorRunner.java:407)
	at com.oracle.svm.hosted.NativeImageGeneratorRunner.build(NativeImageGeneratorRunner.java:585)
	at com.oracle.svm.hosted.NativeImageGeneratorRunner.main(NativeImageGeneratorRunner.java:128)
	at com.oracle.svm.hosted.NativeImageGeneratorRunner$JDK9Plus.main(NativeImageGeneratorRunner.java:615)
Caused by: java.lang.NullPointerException: Cannot invoke "java.util.List.add(Object)" because "varRanges" is null
	at com.oracle.objectfile.debugentry.Range.addVarRanges(Range.java:387)
	at com.oracle.objectfile.debugentry.Range.updateVarRangeMap(Range.java:369)
	at com.oracle.objectfile.debugentry.Range.getVarRangeMap(Range.java:360)
	at com.oracle.objectfile.elf.dwarf.DwarfLocSectionImpl.writeTopLevelLocations(DwarfLocSectionImpl.java:180)
	at com.oracle.objectfile.elf.dwarf.DwarfLocSectionImpl.writePrimaryRangeLocations(DwarfLocSectionImpl.java:170)
	at com.oracle.objectfile.elf.dwarf.DwarfLocSectionImpl.writeMethodLocations(DwarfLocSectionImpl.java:163)
	at com.oracle.objectfile.elf.dwarf.DwarfLocSectionImpl.lambda$writePrimaryClassLocations$0(DwarfLocSectionImpl.java:140)
	at java.base/java.util.stream.ReduceOps$1ReducingSink.accept(ReduceOps.java:80)
	at java.base/java.util.stream.ReferencePipeline$2$1.accept(ReferencePipeline.java:179)
	at java.base/java.util.ArrayList$ArrayListSpliterator.forEachRemaining(ArrayList.java:1625)
	at java.base/java.util.stream.AbstractPipeline.copyInto(AbstractPipeline.java:509)
	at java.base/java.util.stream.AbstractPipeline.wrapAndCopyInto(AbstractPipeline.java:499)
	at java.base/java.util.stream.ReduceOps$ReduceOp.evaluateSequential(ReduceOps.java:921)
	at java.base/java.util.stream.AbstractPipeline.evaluate(AbstractPipeline.java:234)
	at java.base/java.util.stream.ReferencePipeline.reduce(ReferencePipeline.java:667)
	at com.oracle.objectfile.elf.dwarf.DwarfLocSectionImpl.writePrimaryClassLocations(DwarfLocSectionImpl.java:137)
	at com.oracle.objectfile.elf.dwarf.DwarfLocSectionImpl.generateContent(DwarfLocSectionImpl.java:129)
	at com.oracle.objectfile.elf.dwarf.DwarfLocSectionImpl.createContent(DwarfLocSectionImpl.java:104)
	at com.oracle.objectfile.elf.dwarf.DwarfSectionImpl.getOrDecideSize(DwarfSectionImpl.java:541)
	at com.oracle.objectfile.elf.ELFUserDefinedSection.getOrDecideSize(ELFUserDefinedSection.java:105)
	at com.oracle.objectfile.ObjectFile.bake(ObjectFile.java:1625)
	at com.oracle.objectfile.ObjectFile.write(ObjectFile.java:1269)
	at com.oracle.svm.hosted.image.NativeImage.lambda$write$0(NativeImage.java:177)
	at com.oracle.objectfile.ObjectFile.withDebugContext(ObjectFile.java:1801)
	at com.oracle.svm.hosted.image.NativeImage.write(NativeImage.java:176)
	... 7 more
------------------------------------------------------------------------------------------------------------------------
                        4.0s (7.0% of total time) in 40 GCs | Peak RSS: 7.08GB | CPU load: 9.39
========================================================================================================================
Failed generating 'shopcart-wrk-0-3-6-mixed-medium-default-ce' after 57.5s.
Error: Image build request failed with exit status 1

To increase the chance to observe the image build error you can use the following hack

diff --git a/vm/mx.vm/mx_vm_benchmark.py b/vm/mx.vm/mx_vm_benchmark.py
index 3ea672e0010..017bc3aba03 100644
--- a/vm/mx.vm/mx_vm_benchmark.py
+++ b/vm/mx.vm/mx_vm_benchmark.py
@@ -795,6 +795,13 @@ class NativeImageVM(GraalVm):
         final_image_command = config.base_image_build_args + executable_name_args + (pgo_args if instrumented_iterations > 0 or (self.hotspot_pgo and os.path.exists(config.latest_profile_path)) else []) + ml_args
         with stages.set_command(final_image_command) as s:
             s.execute_command()
+            s.execute_command()
 
     def run_stage_run(self, config, stages, out):
         image_path = os.path.join(config.output_dir, config.final_image_name)

@olpaw
Copy link
Member

olpaw commented Jun 14, 2022

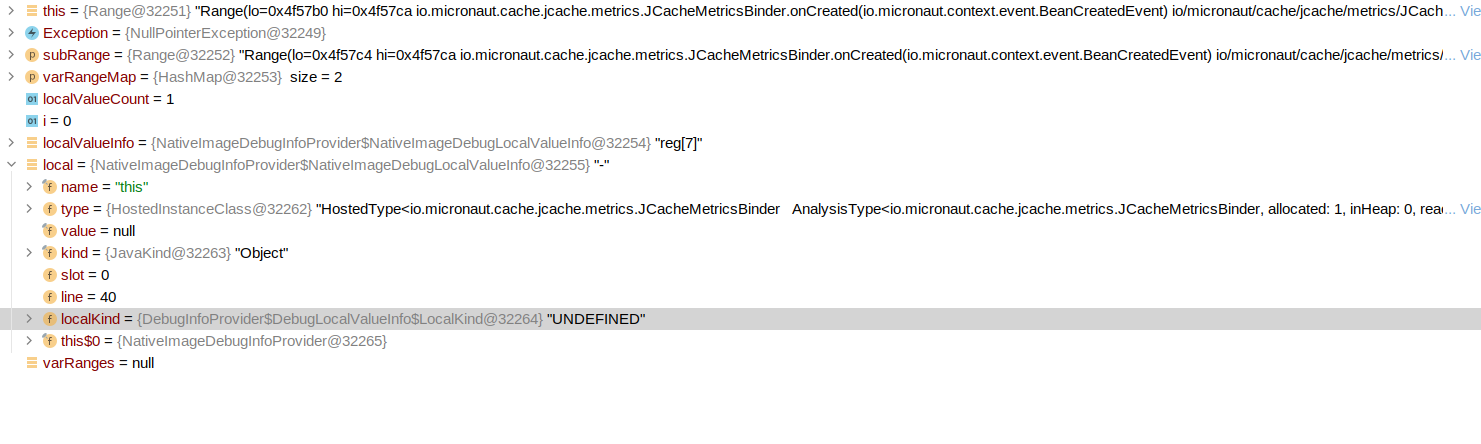
This is what the debugger sees at this point:
image
There seems to be an inconsistency in the kind value of a DebugLocalValueInfo and DebugLocalInfo with the same localValueIndex.

@adinn
Copy link
Collaborator Author

adinn commented Jun 15, 2022

@olpaw Thanks for providing the reproducer, Paul. I tried building repeatedly yesterday but have not yet been able to get the error to occur on my branch (never mind do so when I have enabled debugging or log trace). I'll keep trying and also see if rebasing to master makes a difference.

@olpaw
Copy link
Member

olpaw commented Jun 15, 2022

@olpaw Thanks for providing the reproducer, Paul. I tried building repeatedly yesterday but have not yet been able to get the error to occur on my branch (never mind do so when I have enabled debugging or log trace). I'll keep trying and also see if rebasing to master makes a difference.

@adinn, rebasing should not be necessary. I reproduced with the graalvm repo commit id e16413a
on Fedora Linux 36 on Dell Inc. XPS 17 9700 (i9-10885H), 64.0 GiB RAM

I suspect --strip-jars has to do with it. In this mode proguard is used on to strip debuginfo from class files. E.g. class files with methods where jdk.vm.ci.meta.ResolvedJavaMethod#getLocalVariableTable returns null, method and class names get reduced to single characters, ... debuginfo generation has to be robust against class-files that have been processed with proguard.

A good idea might be to add a check to com.oracle.objectfile.debugentry.Range#setLocalValueInfo that fails immediately if localInfos[i] and localValueInfos[i] kinds ever mismatch.

@adinn
Copy link
Collaborator Author

adinn commented Jun 15, 2022

@olpaw Hi Paul, I have now seen a failure on one run but not when I had the debugger attached.

I suspect --strip-jars has to do with it. In this mode proguard is used on to strip debuginfo from class files. E.g. class files with methods where jdk.vm.ci.meta.ResolvedJavaMethod#getLocalVariableTable returns null, method and class names get reduced to single characters, ... debuginfo generation has to be robust against class-files that have been processed with proguard.

That may well be the case. I have generated full log trace for a run where there was no NPE and in the case of the method you trapped in the debugger it is clear that it has no line or locals info. So, the only local var info that gets included in the range hierarchy appears to be synthetically generated details of the method arguments for a top level range that covers the method prologue range.

That is interesting because the range that shows up in your debugger screenshot includes local info for subrange [0x45f7c4, 0x45f7ca] where the primary range shows the full code range to be [0x4f57b0, 0x45f7ca] i.e. this local is not from the initial prologue range. It might perhaps be a local belonging to some inlined range for code that does have local info. I cannot really check that until I manage to break in the debugger and inspect the Range object but that seems unlikely since the local has name this and the same type as the class owning the primary method i..e if it were inlined it would be another method of the stripped class.

@adinn
Copy link
Collaborator Author

adinn commented Jun 16, 2022

@olpaw I have managed to catch the problem in the debugger and understand something of what is going on.
The problem arises during generation of debug info for method JCacheMetricsBinder.onCreated(BeanCreatedEvent), or rather for one of two such methods because there is a HotSpotResolvedJavaMethodImpl (HRJMI) with return type javax.cache.CacheManager and another HRJMI with return type java.lang.Object. It looks like one might be a bridge method?

Checking the hosted universe reveals that there are indeed two HostedMethod instances that correspond to these two HRJMI instances.

At the point where the error occurs the debug model contains a single ClassEntry for JCacheMetricsBinder which indexes four MethodEntry instances, for

  1. onCreated(BeanCreatedEvent)javax.cache.CacheManager
  2. <clinit>()V
  3. <init>(BeanProvider)V
  4. onCreated(BeanCreatedEvent)java.lang.Object

The compiled method being processed at the point where the error occurs has a primary range [0x4fa600,0x4fa61a] and is identified by method 1. That means the CompiledMethod from which all this info is derived is compiled from a HostedMethod that unwraps to this same HRJMI.

The primary contains 3 subranges:

  1. [0x4fa600,0x4fa60e] identified by method 1 - 2 synthetic locals this, __0
  2. [0x4fa60e,0x4fa614] identified by method 4 - no locals
  3. [0x4fa614,0x4fa611] identified by method 4 - one local this

Each of the subranges is a leaf range. The surprising thing about this is that these ranges are not all associated with method 1. The generator expects all top level leaf frames presented in the
compilation result to point to the original compiled method. Inlined code should appear in a frame/call hierarchy which includes a marker frame for the inlining. So, in this case the compiler appears to be assembling the code for this compiled method from the bytecode for both original Hotspot methods without marking any of it as inline.

I have a suspicion why this is happening but before coming to that I'll explain how this broken invariant that leads to the NPE. The way it works is as follows:

Each MethodEntry tracks the params and locals present in that method using a LocalInfo (stricly an instance of NativeImageDebugLocalInfo). The LocalInfo is a key that can be used to identify the offset of the param/local declaraion in the DWARF info section. That offset is needed when writing the DWARF loc section record that identifies a value present in the subrange.

A subrange records value info for params/locals to the subrange using a LocalValueInfo. At the point during building of the range tree where the values are installed each value is correlated by name, type and slot with a local/params in the subrange's owning method and labelled with the corresponding LocalInfo from that owning method (the association is achieved using two parallel arrays in fields localInfos and localValueInfos).

Later on, when writing loc info for a top level method M, each immediate subrange below the top level method is interrogated to install any local/param values it contains for local/param vars of M. A hash map h is populated with an empty List for each local/param LocalInfo: V1, V2 ... in M using the LocalInfo as a key. If a top-level subrange has a binding B for some local/param V' it looks up the associated list L installed with key V' and adds itself to L. The assert checks that H.get(V') =\= null. i.e. that the local/param V' that keys the binding B in the subrange is actually a local/param for the method. Clearly, when the invariant is broken V' belongs to some other method `M'.

[aside: Actually the same thing happens recursively for each inlined call node where, once again the direct child nodes of a call node ought all to refer to the same identity method. However, this problem only appears to be happening at the top level]

A related oddity may shed light on what is happening. I found is that the two methods are modeled in the debug info with two distinct MethodEntry instances but they both have the same method signatures. In both cases the (return) value type of the method is java.lang.Object.

Now, it's not the presence of two entries that is odd here. That makes sense given the current scheme of using a ResolvedJavaMethod to identify distinct entries. What is odd is that the signature for method 1 is not reported as javax.cache.CacheManager.

I managed to execute the relevant lookup code in the debugger and work out why this is happening. The value type recorded in the MethodEntry is identified by calling hostedMethod.getSignature().getReturnType(null). The immediate signature is a WrappedSignature for the hosted universe method which in turn identifies a WrappedSignature for the analysis universe method. At the end of the chain is a HotspotSignature. It returns an unresolved JavaType with name "Ljavax/cache/CacheManager;" as its return type. The inner
WrappedSignature method call attempts to resolve this type, fails with a link error and instead returns the analysis universe type for Hotspot type java.lang.Object. This in turn is resolved to the
hosted universe type for java.lang.Object by the outer WrappedSignature method call. I remember we have seen this problem before where bridge methods are not always processed during the analysis and, in consequence, their associated types don't always get fully resolved or incorporated into the universe.

So, in the first place this accounts for why we don't see this NPE prior to the identity cleanup patch. In the previous implementation identification of types and methods was performed using the fully
qualified name. The accident that causes these two methods to report the same return type also meant that these references to distinct methods actually look like references to the same method when the FQN is used to determine identity. That ensures that the local values (LocalValueInfo) associated with method 3 are actually looked up and resolved to a local/param (Localinfo) provided by method 1.

Secondly, I wonder if this false equivalence between the two methods might account for why the compiler is assembling a compiled method that includes frame info for method 4 as though it is derived from method 1. I would have expected the compiler to recognise that it has more than one method at play here but perhaps some resolution step is being fooled by the reported signature equivalence into thinking that there is only one source of method bytecode at play here?

Anyway, I think the problem that needs fixing here is in the compiler. The thing that maes it difficutl to analyze what is needed is that in most runs compilation of JCacheMetricsBinder.onCreated appears to proceed diifferently. When I enable log trace I see a much larger amount of generated code (~500 bytes) and many more subranges, including inlined ranges for an object allocation. I'm not really clear why this is happening. Perhaps something to do with the inlining budget?

@adinn
Copy link
Collaborator Author

adinn commented Jun 17, 2022

@olpaw I have investigated further and traced the problem further back into the compilation stage.

I trapped the problem case in the debugger at the point where subranges are notified in DebugInfoBase.addSubRange. The following patch enables a break to be placed at the print statement which catches the error condition. At this point it is still possible to access the <method,compilation_result> pair obtained from the code cache that is used to build the call and range trees.

@@ -403,6 +403,11 @@ public abstract class DebugInfoBase {
         final int line = locationInfo.line();
         ClassEntry subRangeClassEntry = ensureClassEntry(ownerType);
         MethodEntry subRangeMethodEntry = subRangeClassEntry.ensureMethodEntryForDebugRangeInfo(locationInfo, this, debugContext);
+        if (isTopLevel) {
+            if (subRangeMethodEntry != primaryRange.getMethodEntry()) {
+                System.out.println("Found top level range with different method entry to primary");
+            }
+        }
         Range subRange = new Range(stringTable, subRangeMethodEntry, lo, hi, line, primaryRange, isTopLevel, caller);
         classEntry.indexSubRange(subRange);
         subRangeIndex.put(locationInfo, subRange);

Resulting Range Tree

This breaks twice for JCacheMetricsBinder.onCreated as expected and shows the same range and subranges:

the primary has

range [0x4f15b0,0x4fa5ca]
  2 params
    thisParam this:JCacheMetricsBinder slot 0 line 60
    param[0] __0:BeanCreatedEvent slot 1 line 60
  no locals

the subrange at the first break has

  range [0x4f15be,0x4fa5c4]
  no param/local values

the subrange at the second break is

  range [0x4f15c4,0x4fa5ca]
  1 param/local value
    this:JCacheMetricsBinder slot 0, line 40

Underlying CompilationResult

The first oddity appears when looking into what method is reported as having been compiled. HostedMethod@32218 is the one associated with the primary. It unwraps to a Hotspot method whose FQN is:

    JCacheMetricsBinder.onCreated(Lio/micronaut/context/event/BeanCreatedEvent;)Ljavax/cache/CacheManager;

This primary method comes from a <method,compilation_result> pair in the stream returned by CodeCache.getOrderedCompilations().

By contrast, when we look at the CompilationResult it has a compilationId which references HostedMethod@32276. This unwraps to a Hotspot method with this FQN:

  JCacheMetricsBinder.onCreated(Lio/micronaut/context/event/BeanCreatedEvent;)Ljava/lang/Object;

Associated Infopoint/SourceMapping

The CompilationResult has 2 associated Infopoint instances and 3 SourceMapping instances.

Infopoint[0]: offset 14 size 5 bci 2 CALL
Infopoint[1]: offset 20 size 5 bci 0 CALL (stackoverflowerror)

SourceMapping[0] offset 14 end 20 bci 2 no marker
SourceMapping[1] offset 20 end 20 bci 2 no marker
SourceMapping[2] offset 20 end 20 bci 2 no marker

All of them report their owner method to be HostedMethod@32276 i.e. the one that returns a java.lang.Object.

Conclusion

So, the problem here is that the primary range for the whole method and the synthetic range added to cover the method prologue are created using HostedMethod@32218 to provide their id, i.e. the method reported by the code cache as the compiled method on which the compilation result is based. Meanwhile the other ranges have clearly been built by compiling HostedMethod@32276 so this latter method is used to provide their id. The code cache is advertising this result as being for the first method when it has actually been generated by compiling the other variant method.

It seems there are two possible fixes:

  1. Ensure the code cache reports compilation results as belonging to the method actually compiled.
  2. If the code cache must report a compilation result as belonging to some substituted variant of a method then uniformly apply the substitution throughout the infopoint and source mapping structures attached to the compilation result.

I suspect 1. it will probably be relatively easy to implement. However, I am not sure whether it is correct. Perhaps there is some good reason why the code cache is choosing to report the compilation result as belonging to a different method than the one actually compiled?

@olpaw
Copy link
Member

olpaw commented Jun 20, 2022

So, the problem here is that the primary range for the whole method and the synthetic range added to cover the method prologue are created using HostedMethod@32218 to provide their id, i.e. the method reported by the code cache as the compiled method on which the compilation result is based. Meanwhile the other ranges have clearly been built by compiling HostedMethod@32276 so this latter method is used to provide their id. The code cache is advertising this result as being for the first method when it has actually been generated by compiling the other variant method.

It seems there are two possible fixes:

Ensure the code cache reports compilation results as belonging to the method actually compiled.
If the code cache must report a compilation result as belonging to some substituted variant of a method then uniformly apply the substitution throughout the infopoint and source mapping structures attached to the compilation result.

I suspect 1. it will probably be relatively easy to implement. However, I am not sure whether it is correct. Perhaps there is some good reason why the code cache is choosing to report the compilation result as belonging to a different method than the one actually compiled?

I agree, the issue is on the compiler side and not a bug in debuginfo generation.

If we ever observe a CompilationResult where we have a BytecodePosition in an infopoint for non-inlined code that refers to a HostedMethod other than the one this CompilationResult was built for, then this should be seen as corrupt data in that CompilationResult.

@christianwimmer who would be the right person to look into this?

@adinn
Copy link
Collaborator Author

adinn commented Jun 20, 2022

If we ever observe a CompilationResult where we have a BytecodePosition in an infopoint for non-inlined code that refers to a HostedMethod other than the one this CompilationResult was built for, then this should be seen as corrupt data in that CompilationResult.

Agreed. n.b. the details that really stand out here are:

  • we only see BytecodePosition values for the 'wrong' method i.e. /not/ the one the result was supposed to be built for
  • the 'right' method and the 'wrong' method have equal (but not object identical) signatures because the resolution failure promotes the return value in the 'right' method from CacheManager to Object

That first item makes it seem as if the compiler has actually consumed the 'wrong' method wholesale rather than just inlined some of its bytecode.

The second item make me suspicious that a conflation of the right and wrong methods occurred at some point where the analysis/compiler was indexing/looking up the method based on signature.

@adinn
Copy link
Collaborator Author

adinn commented Jun 20, 2022

The second item make me suspicious that a conflation of the right and wrong methods occurred at some point where the analysis/compiler was indexing/looking up the method based on signature.

Or perhaps more likely based on the symbol name derived from the signature?

@adinn
Copy link
Collaborator Author

adinn commented Jun 22, 2022

@olpaw Hi Paul. I have managed to debug the problem further and found the point where the compilation results get mixed up.

I tweaked class CompilationQueue so it ran single-threaded and watched it compile the two versions of method JCacheMetricsBinder.onCreated. This produced two CompilationResult objects, each stored in its associated CompileTask. Obviously the compile tasks reside in the ConcurrentHashMap<HostedMethod,CompileTask> in field compilations with the originating HostedMethod as key.

I found that the problem occurs when this ConcurrentHashMap is converted to a TreeMap<HostedMethod, CompilationResult>. This is done at the point where the native image code cache is created by a call to CompileQueue.getCompilationResults() . The returned TreeMap only contains one CompilationResult for method JCacheMetricsBinder.onCreated and it is keyed using the wrong HostedMethod.

As evidence of that I evaluated the following code at entry to CompileQueue.getCompilationResults() (line 1652)

String val = "";
for (HostedMethod h : compilations.keySet()) {
    if (h.getName().equals("onCreated") && h.getDeclaringClass().getName().contains("JCacheMetricsBinder")) {
        val = val + h.getWrapped().getWrapped().getSignature().toString();
        val = val + " -> ";
        CompileTask task = compilations.get(h);
        CompilationResult res = task.result;
        val = val + res;
        val = val + " id ";
        val = val + res.compilationId;
        val = val + "\n";
    }
}
val;

and obtained the following result

HotSpotSignature<(Lio/micronaut/context/event/BeanCreatedEvent;)Ljava/lang/Object;> -> com.oracle.svm.core.graal.code.SubstrateBackend$1[io.micronaut.cache.jcache.metrics.JCacheMetricsBinder.onCreated(BeanCreatedEvent)Object] id SubstrateHostedCompilation-27077[io.micronaut.cache.jcache.metrics.JCacheMetricsBinder.onCreated(BeanCreatedEvent)]
HotSpotSignature<(Lio/micronaut/context/event/BeanCreatedEvent;)Ljavax/cache/CacheManager;> -> com.oracle.svm.core.graal.code.SubstrateBackend$1[io.micronaut.cache.jcache.metrics.JCacheMetricsBinder.onCreated(BeanCreatedEvent)Object] id SubstrateHostedCompilation-28493[io.micronaut.cache.jcache.metrics.JCacheMetricsBinder.onCreated(BeanCreatedEvent)]

By contrast, I evaluated the following code at the point where the TreeMap in var result is returned (line 1657)

String val = "";
for (HostedMethod h : result.keySet()) {
    if (h.getName().equals("onCreated") && h.getDeclaringClass().getName().contains("JCacheMetricsBinder")) {
        val = val + h.getWrapped().getWrapped().getSignature().toString();
        val = val + " -> ";
        CompilationResult res = result.get(h);
        val = val + res;
        val = val + " id ";
        val = val + res.compilationId;
        val = val + "\n";
    }
}
val;

and obtained the following result

HotSpotSignature<(Lio/micronaut/context/event/BeanCreatedEvent;)Ljava/lang/Object;> -> com.oracle.svm.core.graal.code.SubstrateBackend$1[io.micronaut.cache.jcache.metrics.JCacheMetricsBinder.onCreated(BeanCreatedEvent)Object] id SubstrateHostedCompilation-28493[io.micronaut.cache.jcache.metrics.JCacheMetricsBinder.onCreated(BeanCreatedEvent)]

As you can see the two entries have been merged into one where the method with return type java.lang.Object is now incorrectly keying the result with id 28493. The latter result is the one derived by compiling the method with return type javax.cache.CacheManager.

I am not exactly sure what is happening here but I suspect entries in the TreeMap are being collated according either to signature equality or, what comes to the same thing, to (digest based) method symbol equality. So, a put for the second method leaves the second result under an entry keyed by the the first method's key.

I am also not clear why this is only blowing up intermittently. However, I think detection of the mismatch may depend on the order in which the results get inserted into the tree.

@olpaw
Copy link
Member

olpaw commented Jun 22, 2022

I found that the problem occurs when this ConcurrentHashMap is converted to a TreeMap<HostedMethod, CompilationResult>.

@adinn Congratulations you have found a bug that goes back a looong time.

I suspect com.oracle.svm.hosted.meta.HostedMethod#compareTo returns 0 for the two variants.
Can you check that?

@adinn
Copy link
Collaborator Author

adinn commented Jun 22, 2022

I suspect com.oracle.svm.hosted.meta.HostedMethod#compareTo returns 0 for the two variants. Can you check that?

Well, eyeballing the code says yes but I checked anyway. I evaluated this at entry to CompileQueue.getCompilationResults()

List<Object> l = new ArrayList<>();
for (HostedMethod h : compilations.keySet()) {
    if (h.getName().equals("onCreated") && h.getDeclaringClass().getName().contains("JCacheMetricsBinder")) {
        l.add(h);
    }
}
if (l.size() == 2) {
    HostedMethod h0 = (HostedMethod) l.get(0);
    HostedMethod h1 = (HostedMethod) l.get(1);
    l.add(h0.compareTo(h1));
}
l;

The resulting list prints as:

 0 = {HostedMethod@119114} "HostedMethod<JCacheMetricsBinder.onCreated -> AnalysisMethod<io.micronaut.cache.jcache.metrics.JCacheMetricsBinder.onCreated -> HotSpotMethod<JCacheMetricsBinder.onCreated(BeanCreatedEvent)>>>"
 1 = {HostedMethod@119203} "HostedMethod<JCacheMetricsBinder.onCreated -> AnalysisMethod<io.micronaut.cache.jcache.metrics.JCacheMetricsBinder.onCreated -> HotSpotMethod<JCacheMetricsBinder.onCreated(BeanCreatedEvent)>>>"
 2 = {Integer@215353} 0

So, it's a yes :-)

@olpaw
Copy link
Member

olpaw commented Jun 22, 2022

So, it's a yes :-)

We need to fix this. HostedMethod#compareTo must never return 0 (same for compareTo of HostedType). 😬
@adinn, please create a github issue and assign it to me.

@adinn
Copy link
Collaborator Author

adinn commented Jun 22, 2022

We need to fix this. HostedMethod#compareTo must never return 0 (same for compareTo of HostedType).

Well, that's true. Distinct methods or types should be distinguished and I will raise a bug to that effect.

However, I'm also concerned that by reporting the wrong signature the resolution failure is causing these two distinct methods to look as if they are actually the same, which is why they get conflated in the first place.

Once the compareTo method gets fixed then we will end up in the situation where the debugger is reporting that class JCacheMetricsBinder has two methods called onCreated both with the same FQN. I do not think this will break the debug generator nor, I hope, cause problems for gdb and other debuggers or even other tools that might want to process the debug info. However, I cannot be sure it is not going to be a problem.

Most of all the presence of two identical methods in the type listing is going to look mighty strange to end users. Is there not also a need to fix this resolution problem so we don't end up with lookalike methods?

@adinn
Copy link
Collaborator Author

adinn commented Jun 22, 2022

@olpaw I just raised issue #4667.

@christianwimmer
Copy link

we will end up in the situation where the debugger is reporting that class JCacheMetricsBinder has two methods called onCreated both with the same FQN.

Two methods with the same fully qualified name can occur for many reasons, so we need to be prepared for it and support it correctly. In the worst case if a tool really has a problem with it, then you can a synthetic suffix to the name in the dwarf information. But I hope we are not going to need that.

@christianwimmer
Copy link

christianwimmer commented Jun 22, 2022

And some background information on what could be the reason for a signature conflict: When a signature references a type that has linking errors, we downgrade that type to java.lang.Object:

try {
parameterType = resolve(wrapped.getParameterType(index, defaultAccessingClass));
} catch (LinkageError e) {
/*
* Type resolution fails if the parameter type is missing. Just erase the type by
* returning the Object type.
*/
return universe.objectType();
}

@adinn
Copy link
Collaborator Author

adinn commented Jun 23, 2022

@christianwimmer

And some background information on what could be the reason for a signature conflict: When a signature references a type that has linking errors, we downgrade that type to java.lang.Object:

Yes, I understand that. I mentioned it as the root cause for the conflation of the two methods in my diagnosis of the problem above.

What concerned me was that this possibility of two (or more) methods collapsing to generate the same FQN might lead to other cases were methods are wrongly assimilated. Can we be sure the only problem here in the collation performed when creating the list of methods passed to the code cache. Or are there other parts of the SVM code where a FQN (equivalently, a method symbol), is used to establish identity. For example, could two methods with the same FQN both need to be visible via linker symbols?

Also, I am left wondering why the analysis does not proceed far enough in this case to be able to resolve the return type of the method that gets misreported. It seems rather odd to me that the analysis fails to report an AnalysisType for javax.cache.CacheManager when the compiler happily goes on to compile a method that returns an instance of that very same type. I have not actually investigated the list of types reported by the hosted universe but surely there needs to be a HostedType for javax.cache.CacheManager -- or, at least, an AnalysisType, in order for the compilation to complete? Or does the compile proceed simply by consuming the HotspotResolvedJavaTypeImpl?

@adinn adinn force-pushed the debug_id_cleanup branch from e16413a to f1b32e7 Compare July 18, 2022 09:39
@oracle-contributor-agreement oracle-contributor-agreement bot added the OCA Verified All contributors have signed the Oracle Contributor Agreement. label Jul 18, 2022
@adinn
Copy link
Collaborator Author

adinn commented Jul 18, 2022

@olpaw After rebasing this to the latest head (which includes the fix for #4667) I believe it should now pass the internal Oracle gate. Can we have another try at merging?

@graalvmbot graalvmbot merged commit 8b38a08 into oracle:master Jul 19, 2022
@fniephaus
Copy link
Member

It has passed all the gates and was also merged already....thanks again for contributing, @adinn!

@adinn
Copy link
Collaborator Author

adinn commented Jul 20, 2022

@fniephaus Hurrah! Thanks for your help.

Sign up for free to join this conversation on GitHub. Already have an account? Sign in to comment

Labels

OCA Verified All contributors have signed the Oracle Contributor Agreement. oca-signed

Projects

None yet

Development

Successfully merging this pull request may close these issues.

6 participants